Wolf of Trading® Crypto Signals — Independent Review
Wolf of Trading® is a Telegram crypto trading signals channel tracked by PNL Mama. Over the last 30 days this channel published 15 closed trades with an actual win rate of 40%. On a virtual account that puts 10% of its money into every trade and ignores the leverage written in the post, $1000 would have become $1 011 over 90 days. PNL Mama monitors every signal at the source and publishes the verified track record without edits.
Wolf of Trading® — Verified Performance Summary
These results are tracked independently by PNL Mama and computed automatically from Wolf of Trading®'s published signals against real exchange prices — no edits, no cherry-picking. Of the last 15 closed trades, 6 finished in profit (40% win rate). The worst recorded trade returned -100%, and the average losing trade -61%. At its worst the account was 5.9% below its own peak, the profit factor 0.48, and the longest losing streak 4 trades in a row.
Wolf of Trading® — Full Track Record
PNL Mama has been tracking Wolf of Trading® since . Over the full tracking period, 77 trades were closed, 43 of them in profit (56% all-time win rate), for a total realized P&L of +54 USDT on a flat $100 stake per trade. The all-time maximum drawdown is -646 USDT on that same stake with a profit factor of 1.03. The 30-day summary above shows current form; the full record shows sample size and trajectory.
Wolf of Trading® Trading Style
Across all tracked signals, Wolf of Trading® trades 56.99% long and 43.01% short.
Most Traded Pairs by Wolf of Trading®
- BTCUSDT — 28 trades
- BNBUSDT — 7 trades
- CHZUSDT — 5 trades
- ETCUSDT — 5 trades
- INJUSDT — 5 trades
- APTUSDT — 4 trades
Recent Trades by Wolf of Trading®
- CHZUSDT SHORT ×10 — LIVE +35% (17 Oct 2026)
- BTCUSDT SHORT ×10 — LIVE +2% (15 Oct 2026)
- PEPEUSDT LONG ×10 — -42% (15 Oct 2026)
- BTCUSDT SHORT ×10 — LIVE -1% (14 Oct 2026)
- BTCUSDT SHORT ×10 — +39% (13 Oct 2026)
- XTZUSDT SHORT ×10 — -56% (12 Oct 2026)
- BTCUSDT SHORT ×10 — LIVE +9% (09 Oct 2026)
- CHRUSDT SHORT ×10 — -100% (08 Oct 2026)
- LINKUSDT SHORT ×10 — +31% (08 Oct 2026)
- LINKUSDT SHORT ×10 — +54% (07 Oct 2026)
Market Outlook — Wolf of Trading®'s market view
A view on the market, not a trade. No entry, no result — kept for context, never counted in win rate or rankings.
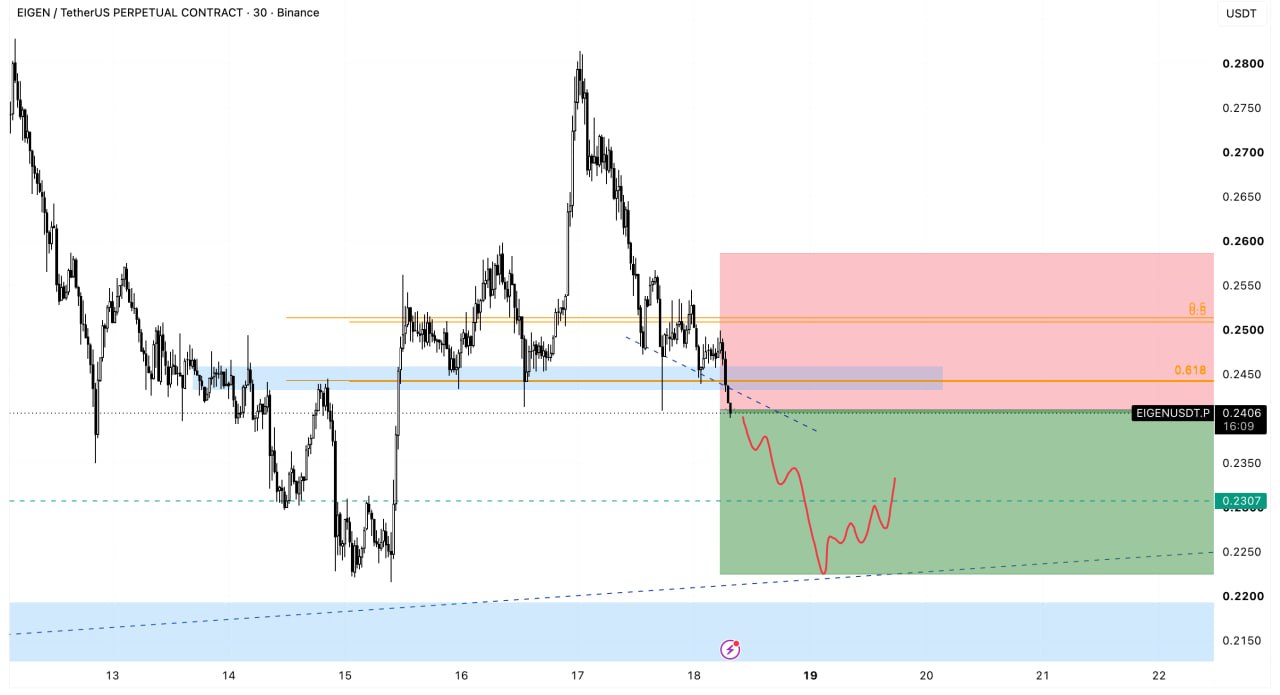
EIGENUSDT
What Wolf of Trading® said
After a sharp rise to about 0.2800 the price has dropped back and is now near 0.2408, just under the 0.2450–0.2510 area that has been capping it. The red path drawn on the chart suggests it may first dip toward 0.2220–0.2280 before any recovery.
If price moves up: если цена сильно поднимется от области 0.2220–0.2280 → возможен рост к 0.2450, затем к 0.2510, затем к прежним локальным максимумам
If price moves down: если цена оттолкнётся вниз от области 0.2450–0.2510 → возможно снижение к 0.2300, затем к 0.2250, затем к 0.2220; этот сценарий отменяется, если цена уйдёт выше 0.2510 и останется там
Published •
BTCUSDT
What Wolf of Trading® said
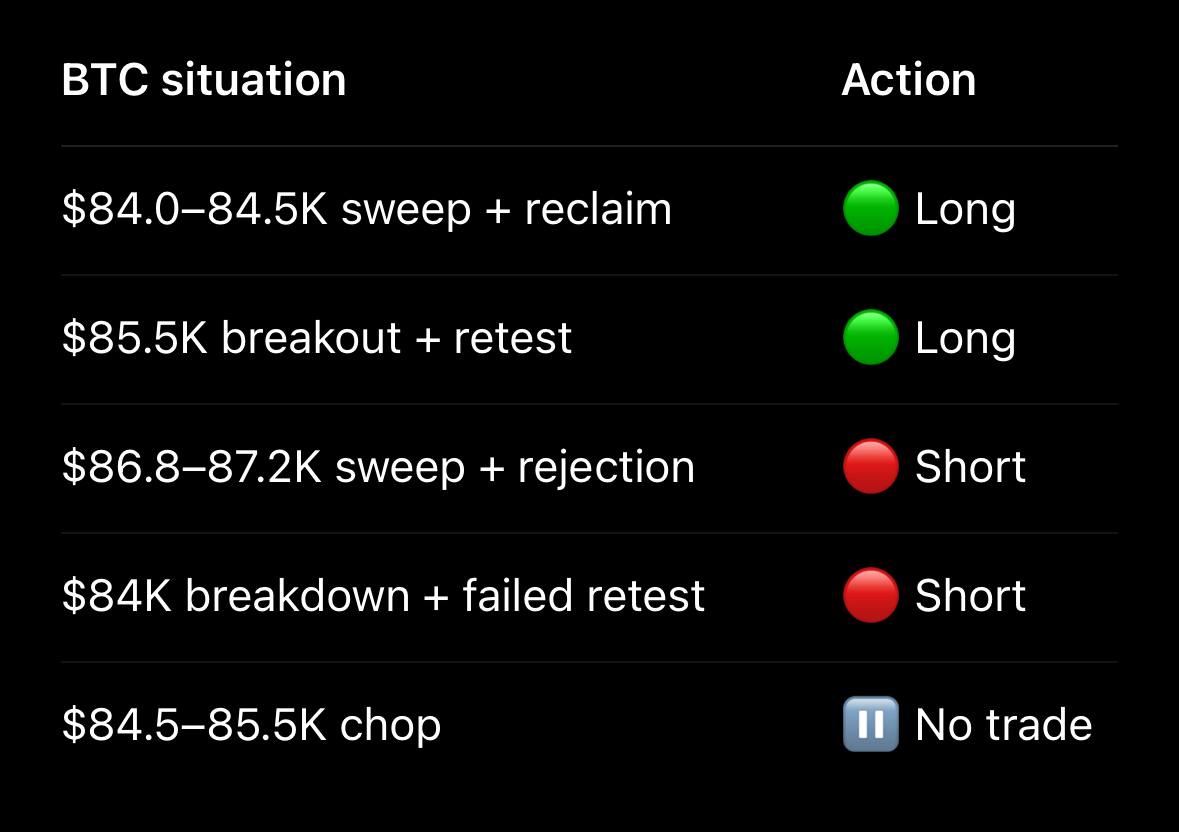
Bitcoin is stuck in a narrow 84.5–85.5K area with no clear direction yet; each side of this range points to a different path, so the market is waiting for price to pick one.
If price moves up: if price moves up through 85.5K → the next move is likely higher; if it instead dips to 84.0–84.5K and buyers return there → that also points up
If price moves down: if price drops below 84K → the move likely continues down; if it instead rises to 86.8–87.2K and sellers take over there → that also points down
Published •
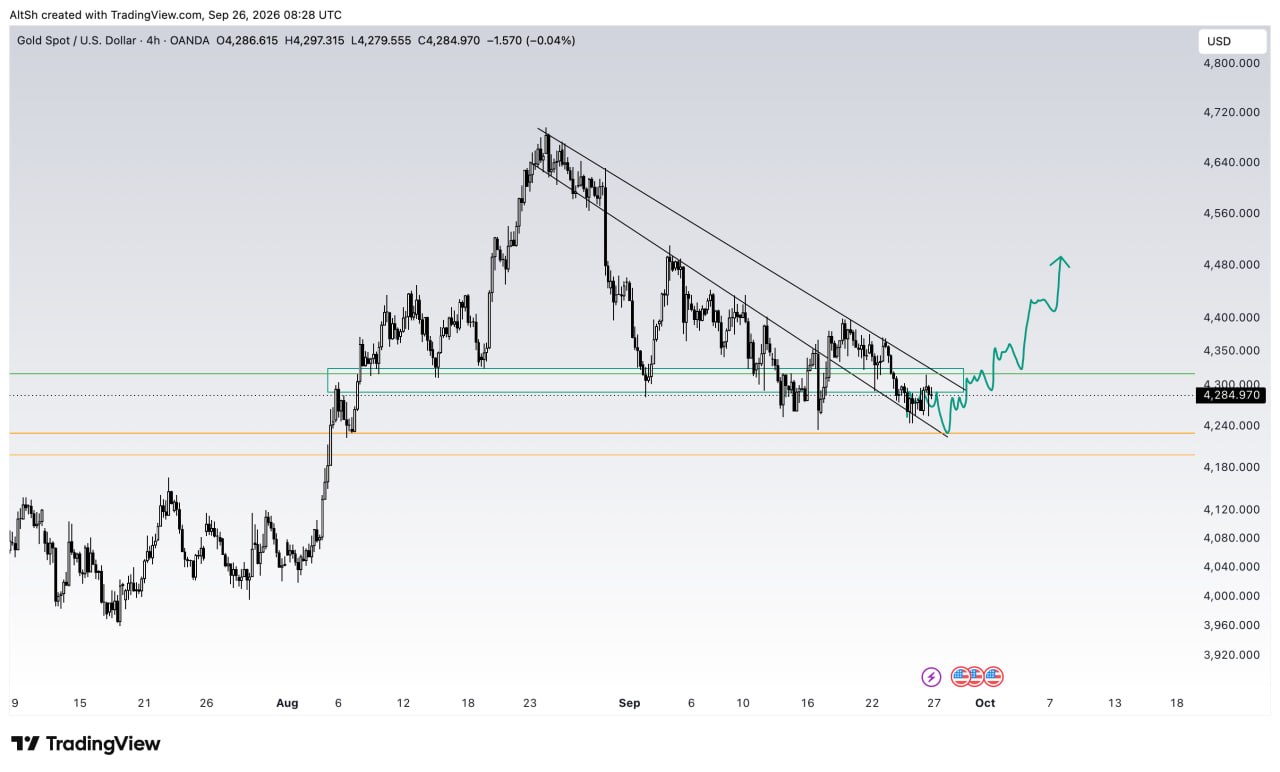
XAUUSD
What Wolf of Trading® said
Gold has been falling for a while and is now moving without a clear direction, stuck between two levels the trader is watching closely.
If price moves up: if the price rises above the green line shown on the chart → the trader expects gold to move up
If price moves down: if the price falls below the golden level → the trader expects gold to move down
Published •
BTCUSDT
What Wolf of Trading® said
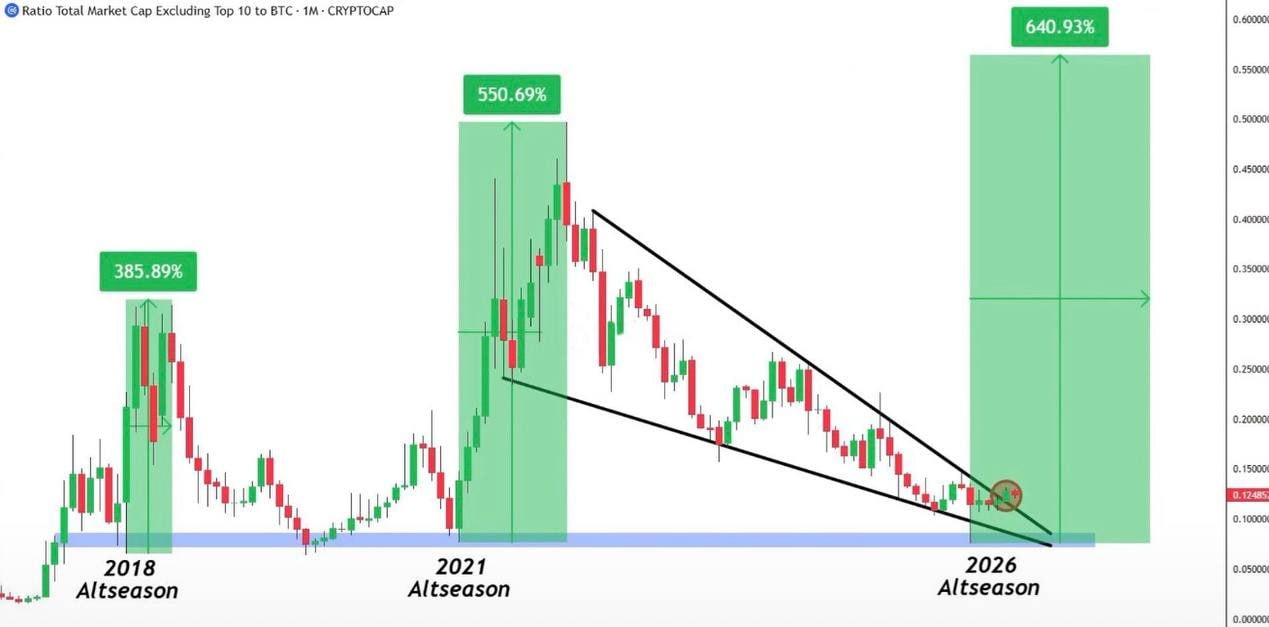
The crypto market is currently at a historically significant point: the index reflecting the share of all coins except the top ten relative to Bitcoin is at a key fork, marked on the monthly chart since 2017. After a prolonged decline and three previous capital flows into altcoins (2018, 2021, and now), the market stands at the threshold of a new cycle — the three previous cases delivered gains of 385%, 550%, and 640%. Currently, the price is at 0.12485 (red label), slightly above an important zone near the base of the pattern.
If price moves up: if the index holds above the 0.10 zone and confirms a breakout of the ascending trend from the large triangle → a strong rise to 0.30 and then to 0.55 is likely (repeating patterns from 2018 and 2021; third target — 0.60+ in line with the current cycle)
If price moves down: if the index drops below 0.10 again and consolidates within the triangle → a new wave of decline toward the lower boundary of 0.08 and below, delaying the start of the altcoin season
Published •
TOTAL3USDT
What Wolf of Trading® said
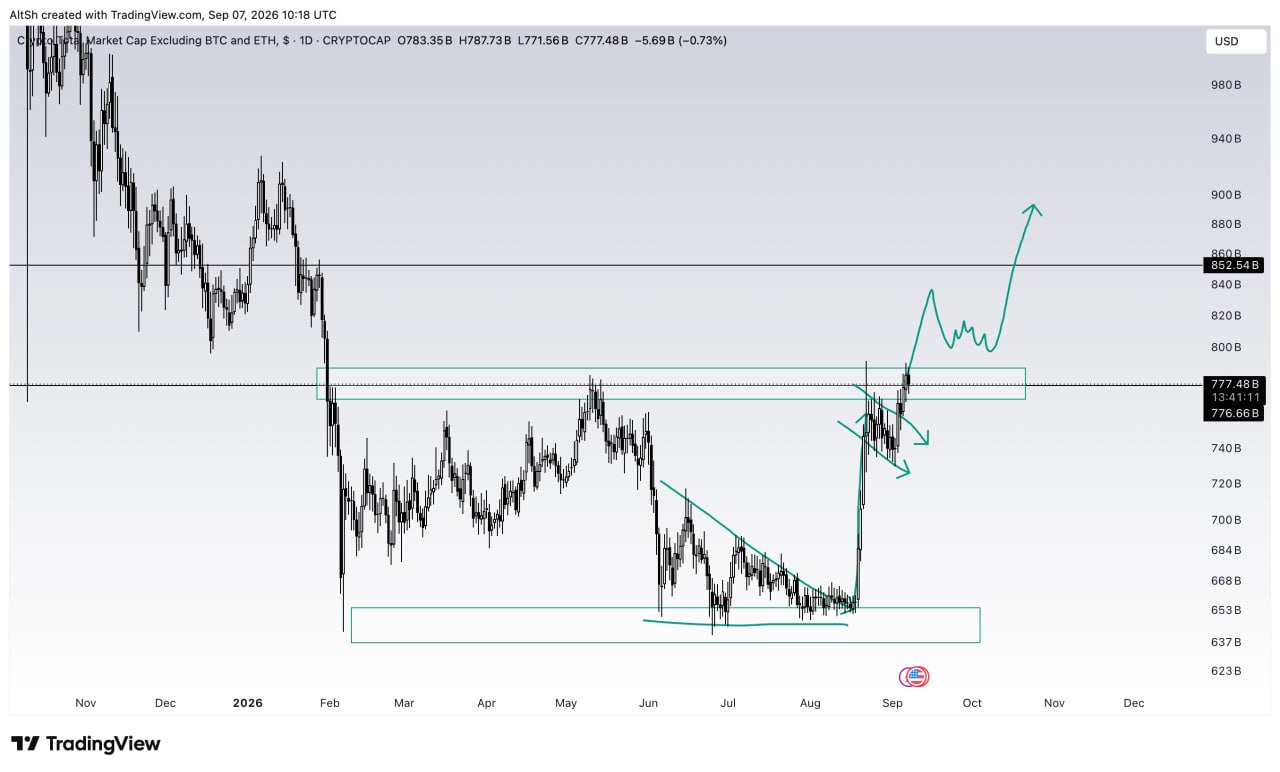
The altcoin market has contracted into a sideways range and is now approaching a key resistance level — a ceiling above which price has struggled to hold for long. If bulls manage to break through this ceiling, there's a chance for a strong upward surge and the start of what's called the 'altcoin season'; if not, price may retreat lower.
If price moves up: if price holds above 777.45B → likely rise to second weekly resistance ~860B and development of alt-season
If price moves down: if breakout of 777.45B fails → return to sideways range and decline to lower zone 637–660B
Published •
BTCUSDT
What Wolf of Trading® said
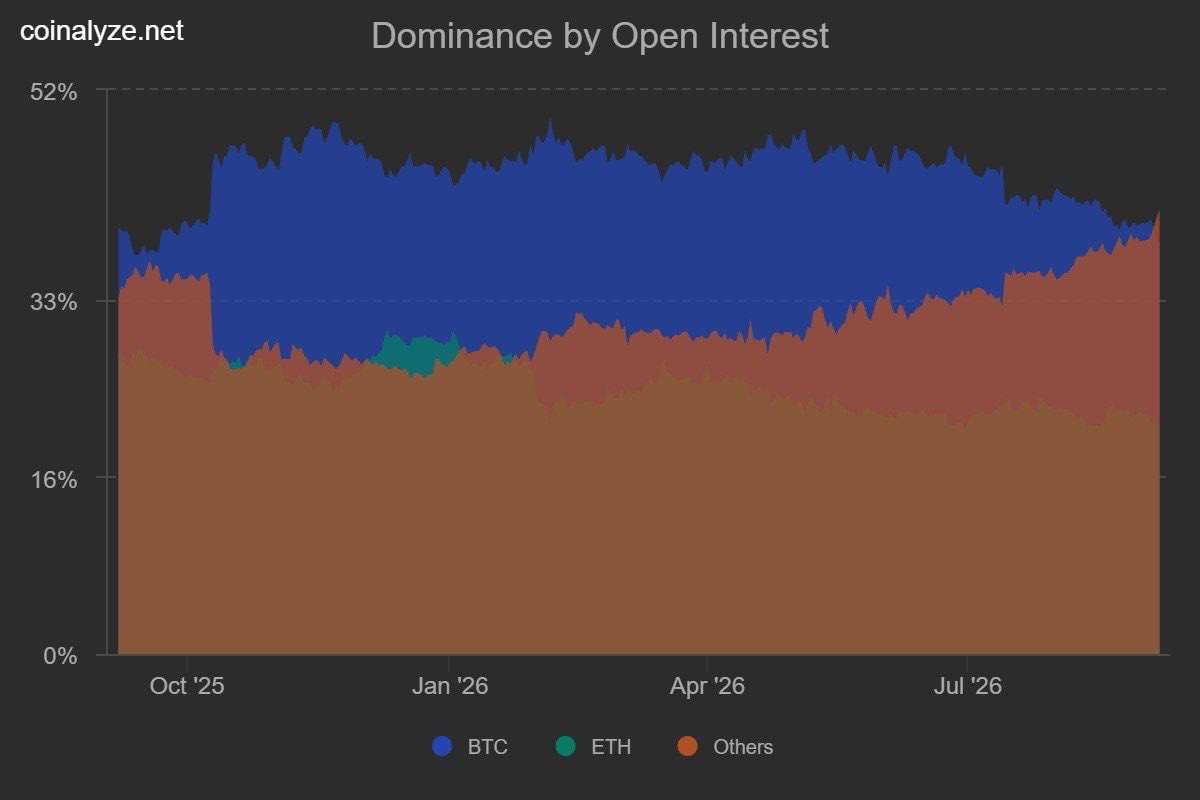
The share of altcoins in total open interest has surpassed Bitcoin's share for the first time in a long while — speculative leverage is shifting from BTC to other coins.
If price moves up: Historically, rising altcoin share has coincided with sharp rallies in individual coins and increased upward volatility.
If price moves down: The same rotation of leverage into altcoins is usually followed by sharper, widespread liquidations when the trend reverses.
Published •