Wall Street Queen Official Crypto Signals — Independent Review
Wall Street Queen Official is a Telegram crypto trading signals channel tracked by PNL Mama. Over the last 30 days this channel published 18 closed trades with an actual win rate of 44%. On a virtual account that puts 10% of its money into every trade and ignores the leverage written in the post, $1000 would have become $1 077 over 90 days. PNL Mama monitors every signal at the source and publishes the verified track record without edits.
Channels With Similar Names
Several tracked Telegram channels use a name similar to “Wall Street Queen Official”. PNL Mama tracks each one independently and does not verify which is the original — make sure you are viewing the channel you are looking for before subscribing.
| Channel | Telegram | Subscribers | Closed trades (30d) | Win rate (30d) |
|---|---|---|---|---|
| Wall Street Queen Official (this page) | @wallstreetqueenofficial | 198760 | 18 | 44% |
| Wall Street Queen OFFICIAL ®️ | @wallstreetqueenofficialTG | 198149 | 14 | 36% |
Wall Street Queen Official — Verified Performance Summary
These results are tracked independently by PNL Mama and computed automatically from Wall Street Queen Official's published signals against real exchange prices — no edits, no cherry-picking. Of the last 18 closed trades, 8 finished in profit (44% win rate). The worst recorded trade returned -100%, and the average losing trade -60%. At its worst the account was 3.3% below its own peak, the profit factor 0.96, and the longest losing streak 3 trades in a row.
Wall Street Queen Official — Full Track Record
PNL Mama has been tracking Wall Street Queen Official since . Over the full tracking period, 101 trades were closed, 56 of them in profit (55% all-time win rate), for a total realized P&L of +290 USDT on a flat $100 stake per trade. The all-time maximum drawdown is -698 USDT on that same stake with a profit factor of 1.12. The 30-day summary above shows current form; the full record shows sample size and trajectory.
Wall Street Queen Official Trading Style
Across all tracked signals, Wall Street Queen Official trades 76.19% long and 23.81% short.
Most Traded Pairs by Wall Street Queen Official
- BTCUSDT — 18 trades
- ETHUSDT — 11 trades
- BNBUSDT — 5 trades
- ALTUSDT — 3 trades
- ANKRUSDT — 3 trades
- GRTUSDT — 3 trades
Recent Trades by Wall Street Queen Official
- BNBUSDT LONG ×10 — LIVE (19 Oct 2026)
- ENJUSDT SHORT ×10 — LIVE +13% (18 Oct 2026)
- LINKUSDT SHORT ×10 — LIVE -17% (18 Oct 2026)
- C98USDT SHORT ×10 — LIVE -14% (18 Oct 2026)
- ETHUSDT LONG ×10 — LIVE -9% (17 Oct 2026)
- ENJUSDT LONG ×10 — LIVE -64% (17 Oct 2026)
- RSRUSDT LONG ×10 — -48% (17 Oct 2026)
- BTCUSDT LONG ×10 — -4% (12 Oct 2026)
- ANKRUSDT LONG ×10 — -27% (11 Oct 2026)
- BEAMXUSDT LONG ×10 — +86% (09 Oct 2026)
Market Outlook — Wall Street Queen Official's market view
A view on the market, not a trade. No entry, no result — kept for context, never counted in win rate or rankings.
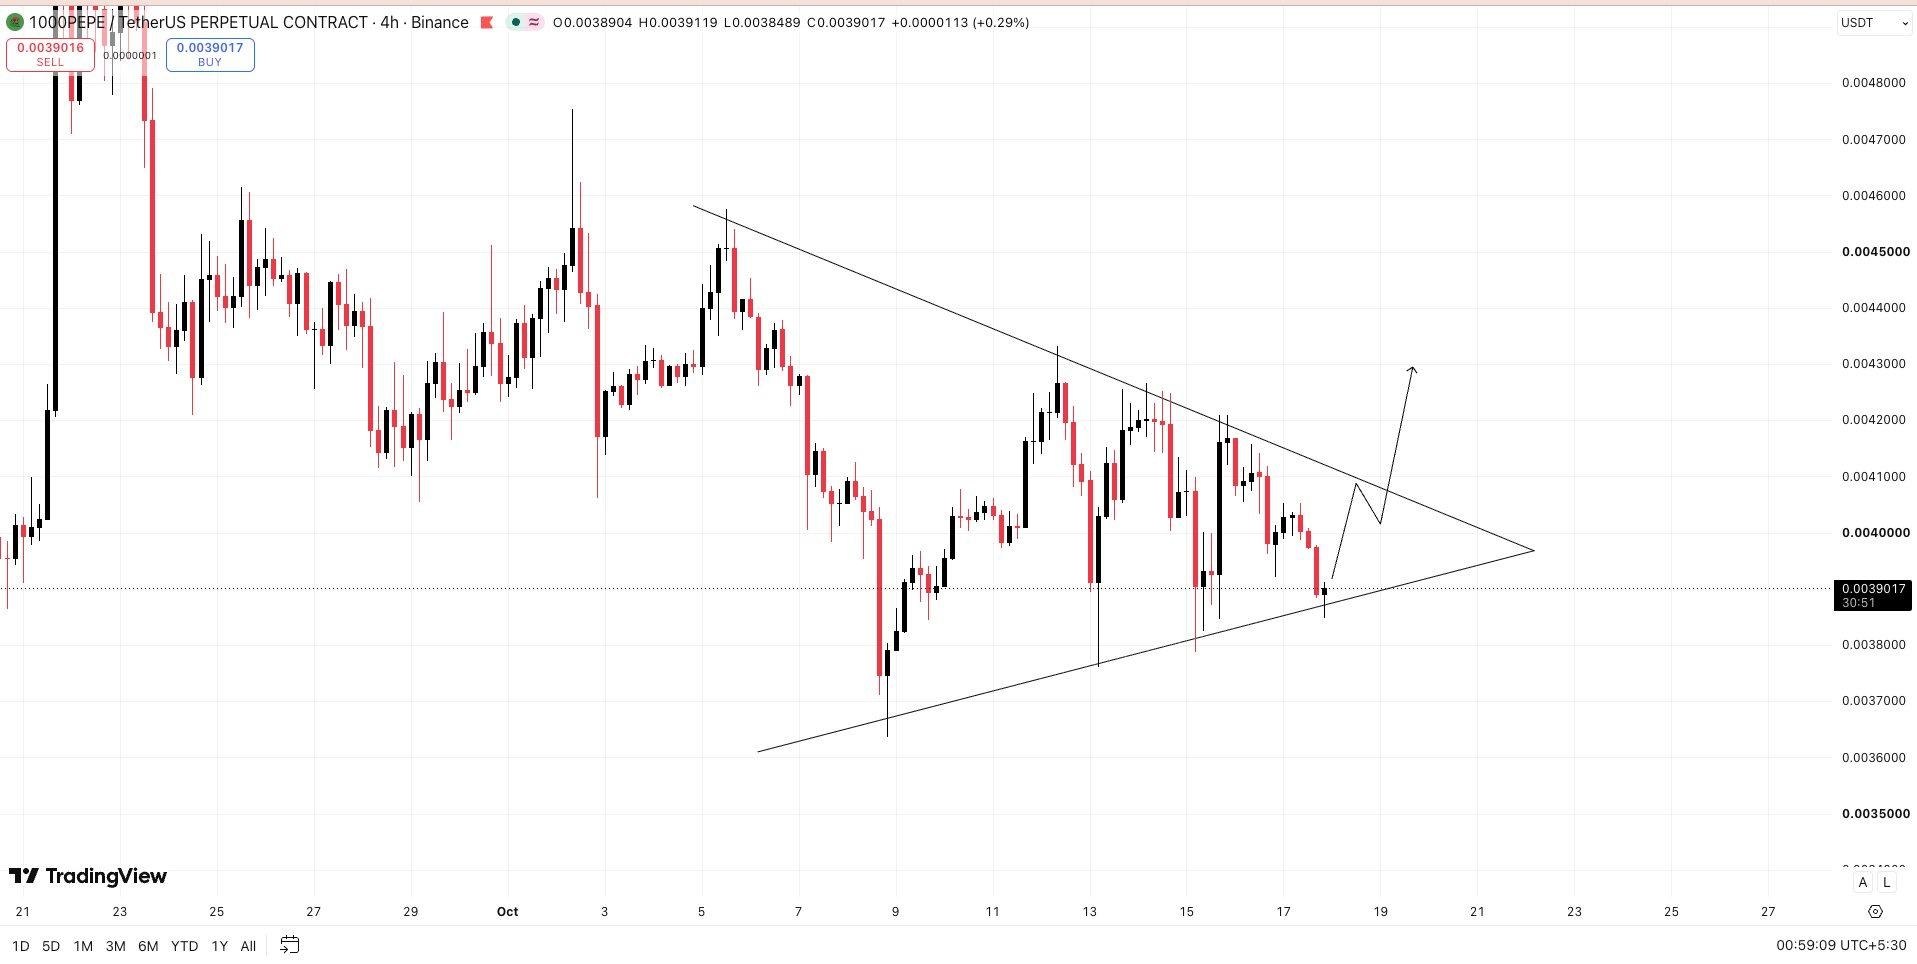
1000PEPEUSDT
What Wall Street Queen Official said
Price is trading near $0.00390 and has been swinging in a tightening range, so the market is waiting to see which direction it picks next.
If price moves up: if price bounces from the lower part of the current range and climbs above its upper edge, further gains are likely
If price moves down: if price drops and falls below the lower edge of the current range, a further decline is likely
Published •
BTCUSDT
What Wall Street Queen Official said
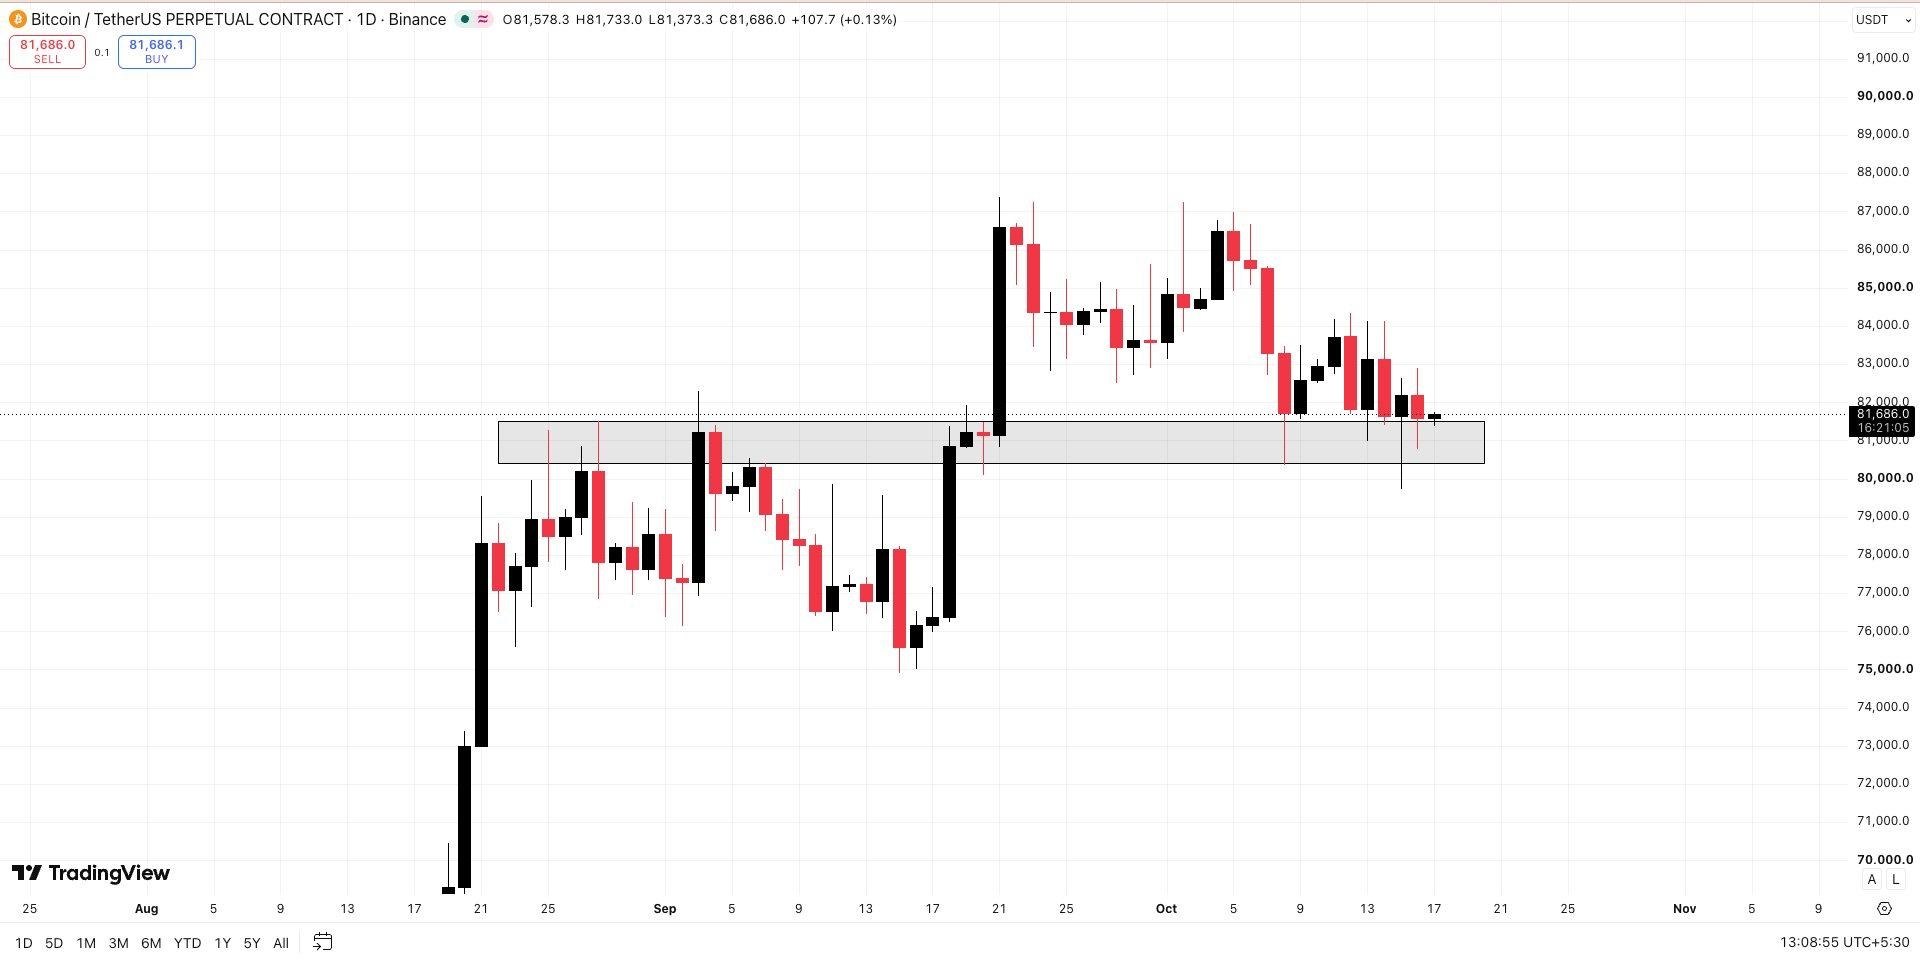
Bitcoin is trading near $81,700, right at a price area where it already stopped falling earlier this month; the market is now waiting to see whether that area holds or gives way.
If price moves up: if buyers keep the price above roughly $81,700 → a move up toward $84,000–$85,000 becomes likely
If price moves down: if the price drops below that area → the decline is likely to continue, the post gives no lower target
Published •
BTCUSDT
What Wall Street Queen Official said
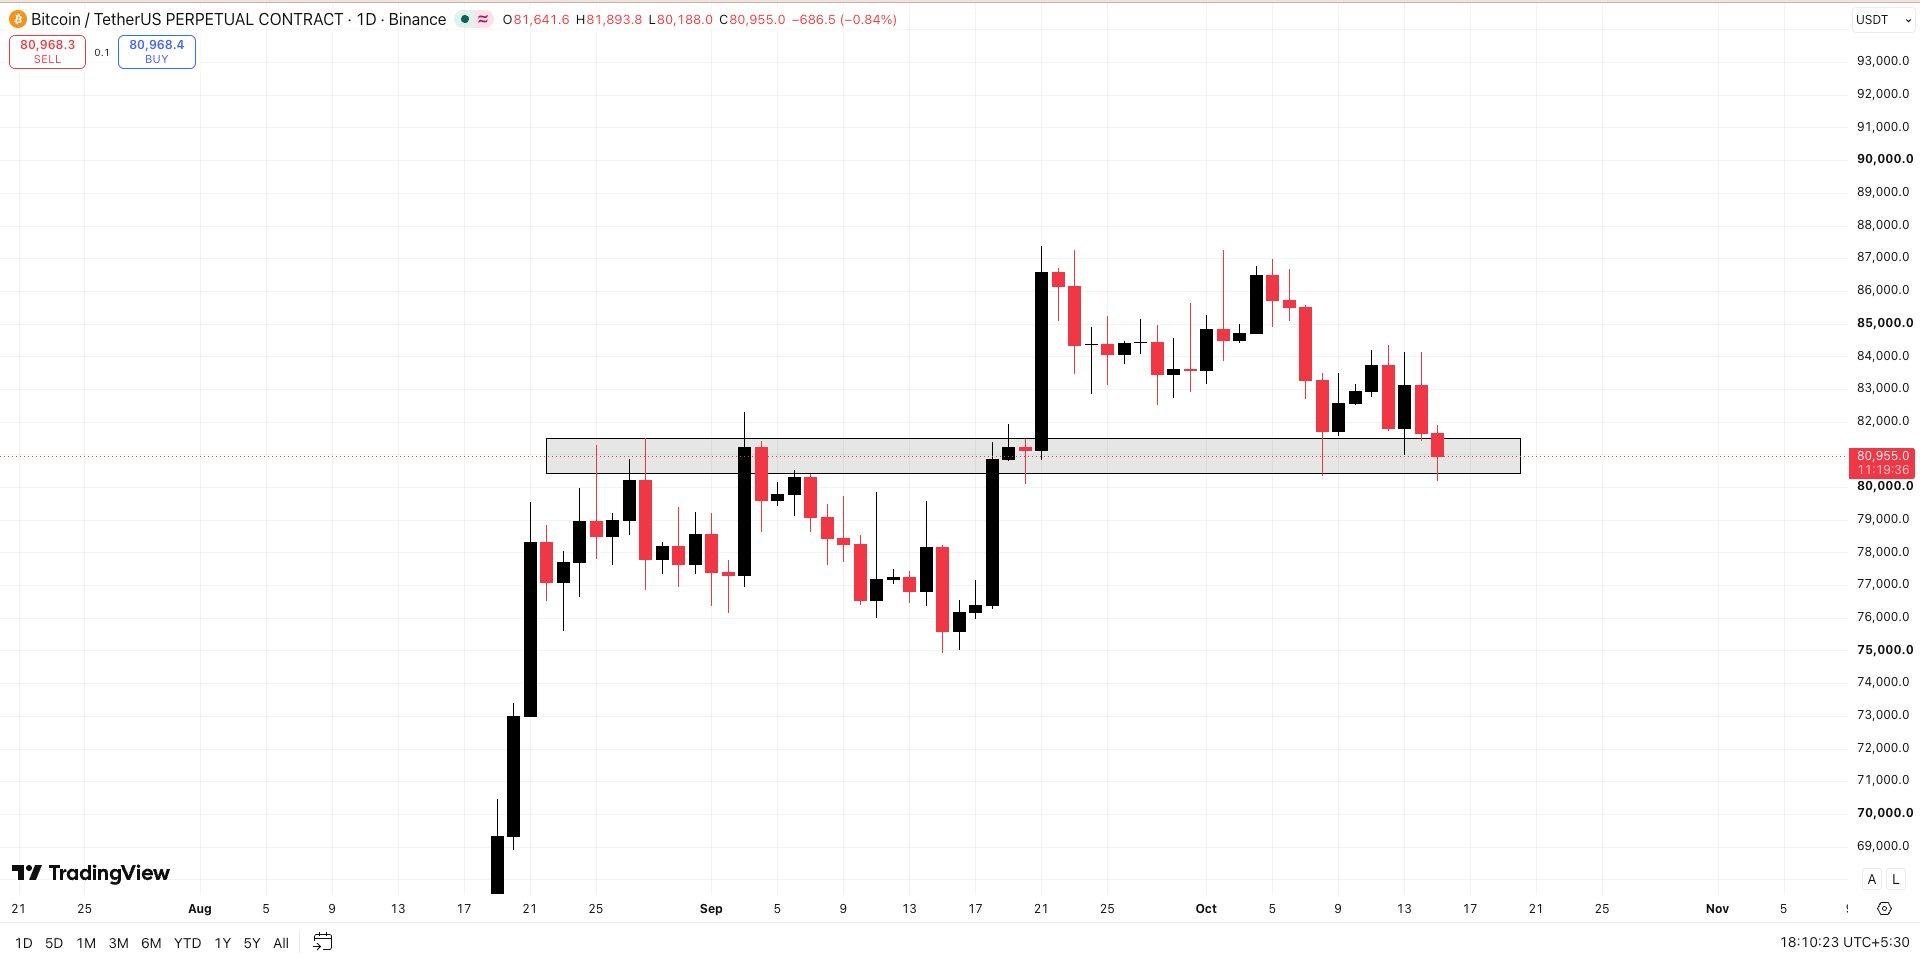
Bitcoin is trading around $80,900, at a level where the fall had stopped several times before — right now the market has not decided yet where it will go next.
If price moves up: if the price stays above the current area around $80,900 → a move upward is possible
If price moves down: if the price falls below the current area around $80,900 → a further decline toward $76,000 is likely
Published •
BTCUSDT
What Wall Street Queen Official said
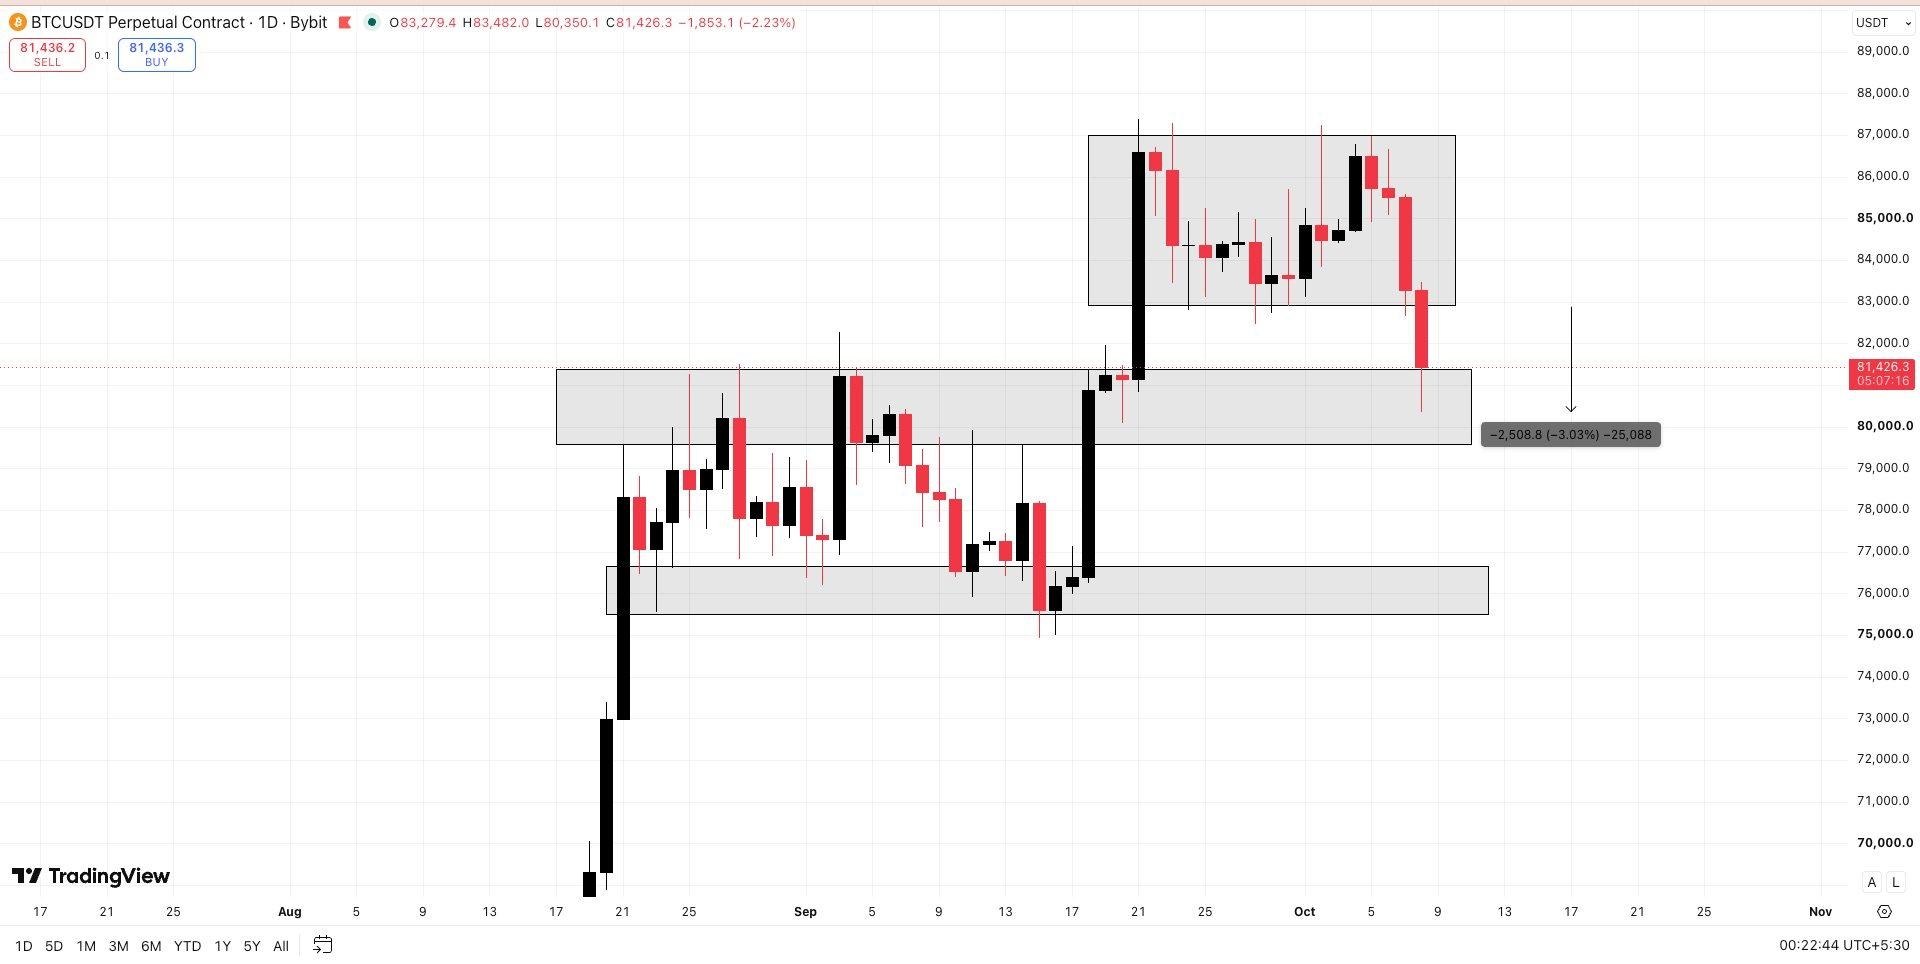
Bitcoin is currently around $81,600 and continues to fall, as expected earlier. The price has approached an important zone from which it previously bounced; further movement depends on whether it holds here or breaks lower.
If price moves up: if the price holds near current levels around $81,600 and does not go lower → a potential rebound upward is possible
If price moves down: if the decline continues and the price drops below this zone → further downside to lower levels is likely
Published •
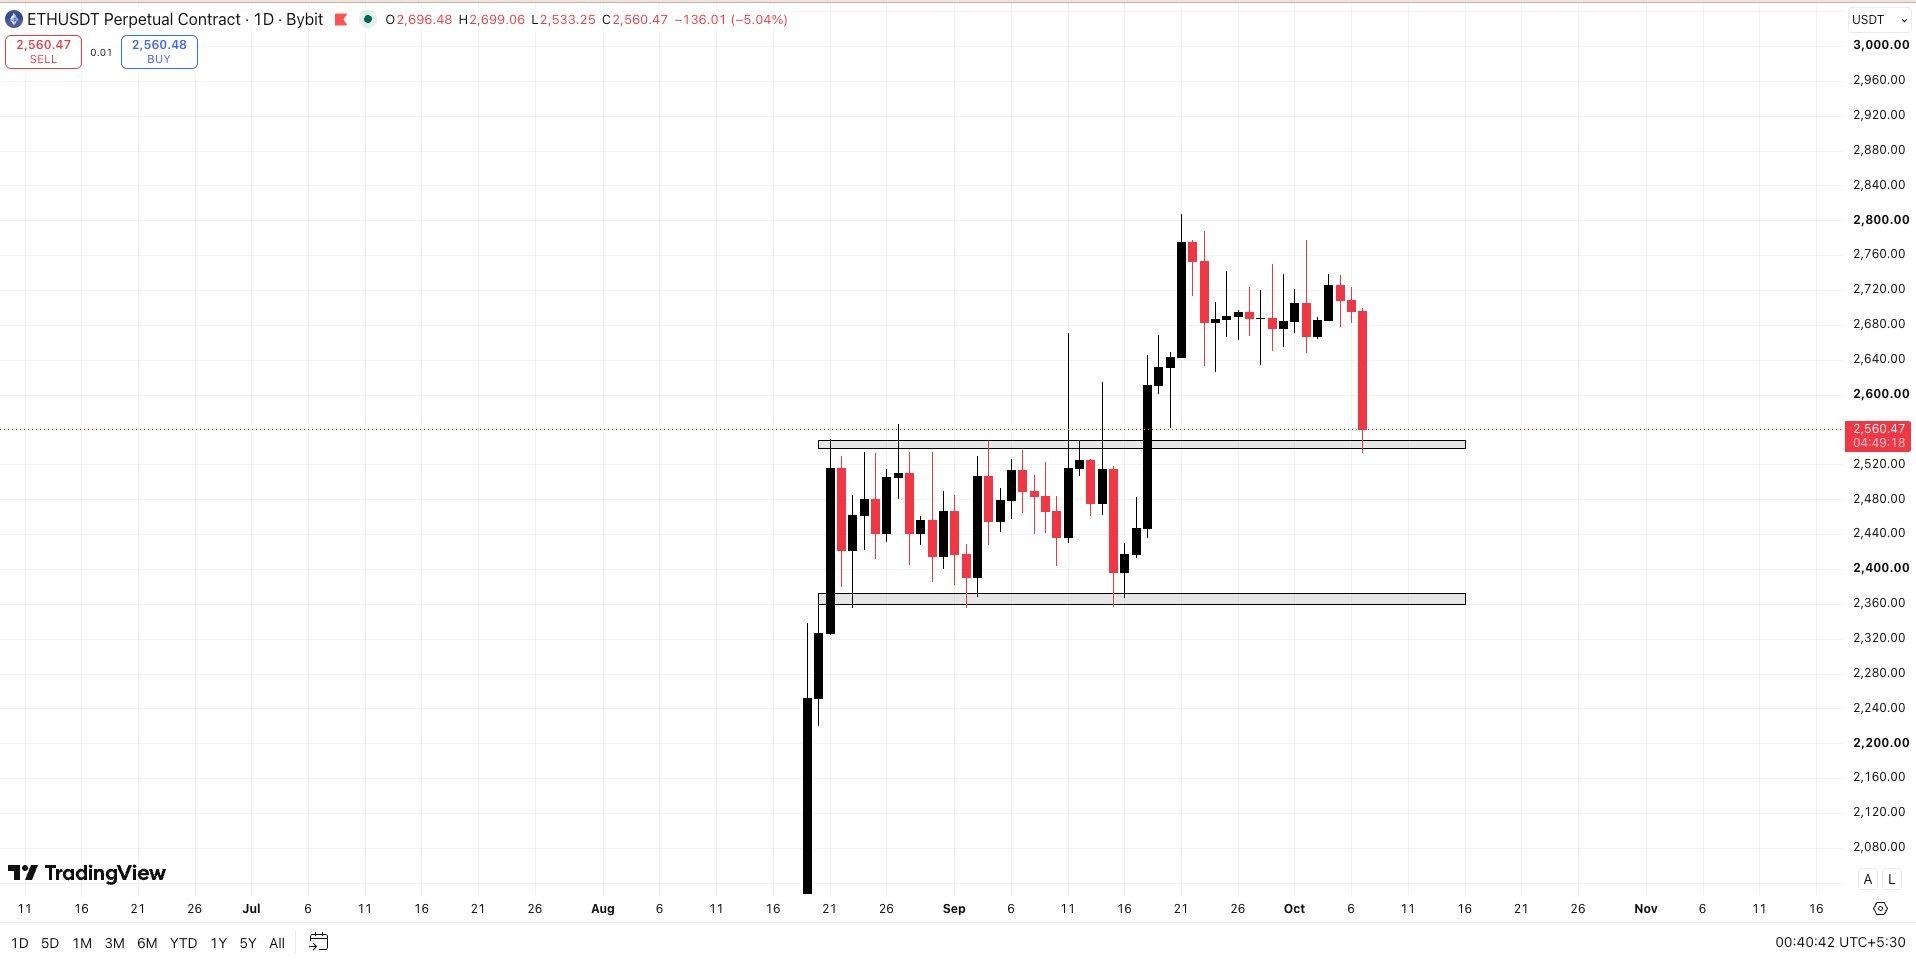
ETHUSDT
What Wall Street Queen Official said
Price is around $2563 and sitting right on a level that has held it up before, so the market is deciding whether that level keeps holding or gives way.
If price moves up: if the price holds above 2563 and turns back up → a rebound (pump) could follow
If price moves down: if the price drops below 2563 → it can keep falling toward the next lower level
Published •
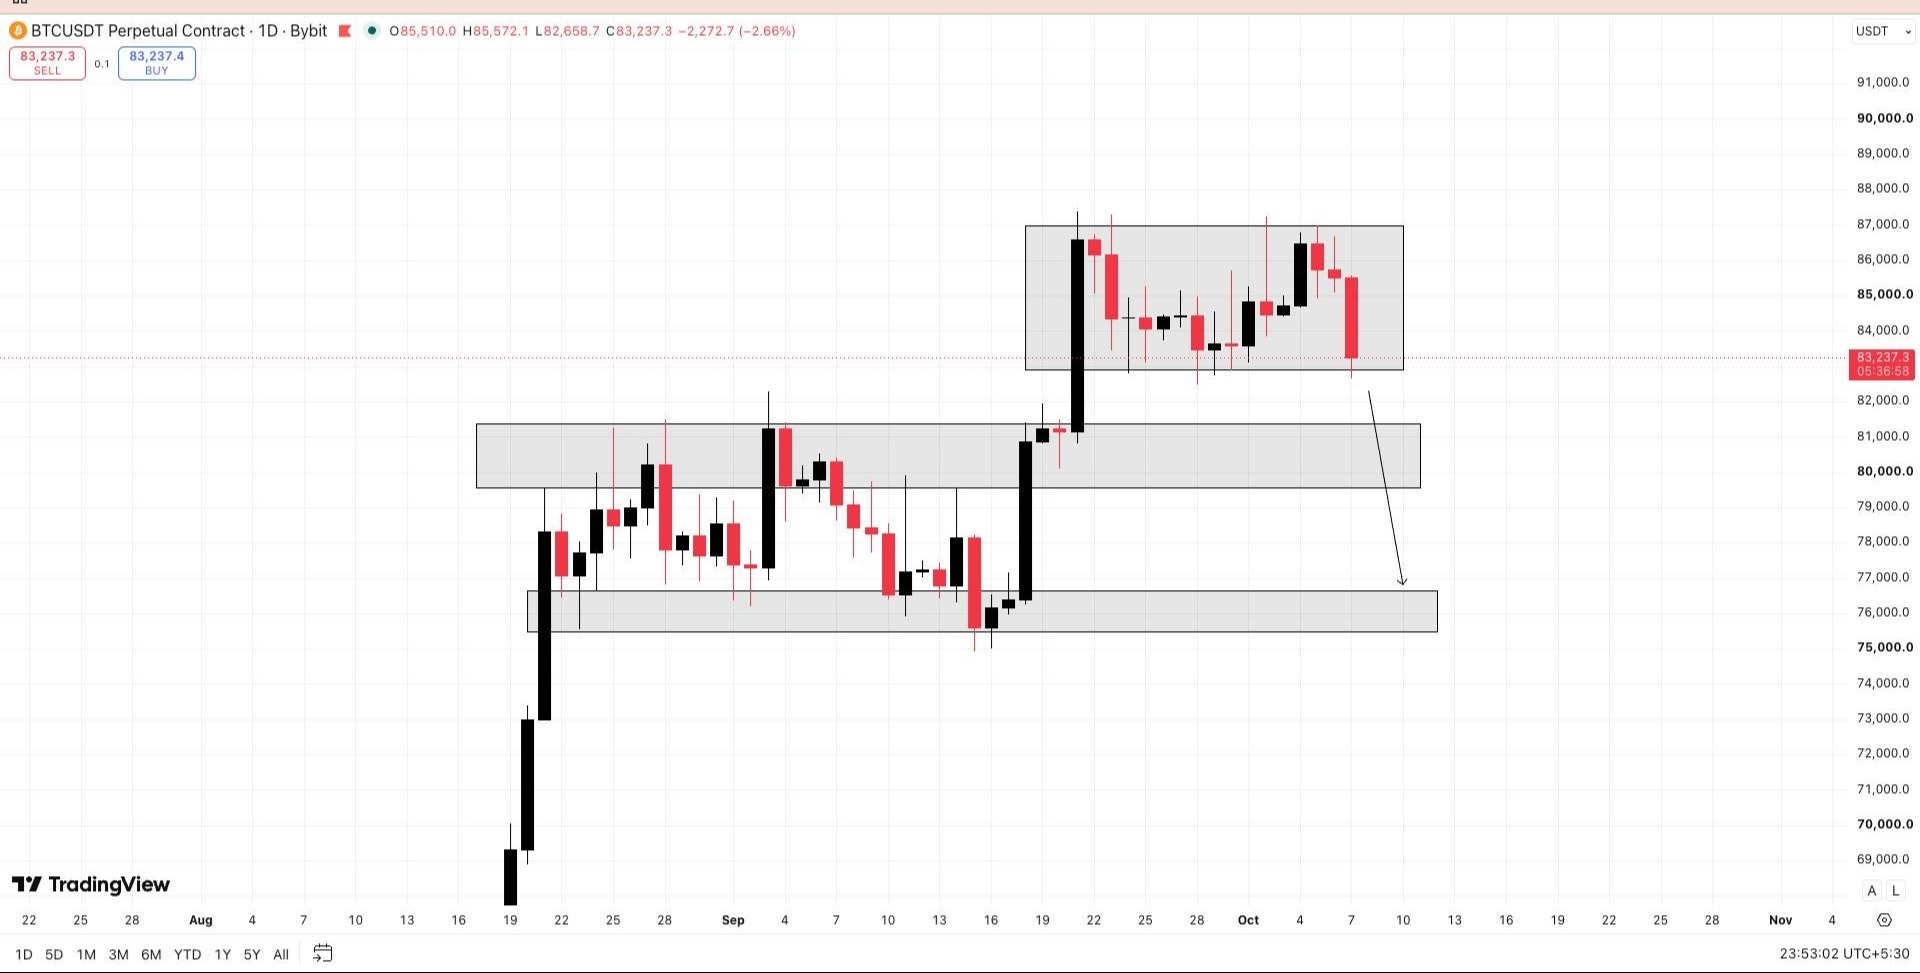
BTCUSDT
What Wall Street Queen Official said
Bitcoin is trading around 83,300 and has been moving within a sideways range for some time — the market hasn't yet decided which direction to go next.
If price moves up: if price holds at current levels around 83,300 → possible rise toward the upper area marked on the chart, followed by further upward movement
If price moves down: if price drops below the current area → likely downward movement toward the lower area marked on the chart
Published •