تیگنال | ترید سیگنال Crypto Signals — Independent Review
تیگنال | ترید سیگنال is a Telegram crypto trading signals channel tracked by PNL Mama. Over the last 30 days this channel published 22 closed trades with an actual win rate of 32%. On a virtual account that puts 10% of its money into every trade and ignores the leverage written in the post, $1000 would have become $915 over 90 days. PNL Mama monitors every signal at the source and publishes the verified track record without edits.
تیگنال | ترید سیگنال — Verified Performance Summary
These results are tracked independently by PNL Mama and computed automatically from تیگنال | ترید سیگنال's published signals against real exchange prices — no edits, no cherry-picking. Of the last 22 closed trades, 7 finished in profit (32% win rate). The worst recorded trade returned -100%, and the average losing trade -68%. At its worst the account was 9.7% below its own peak, the profit factor 0.23, and the longest losing streak 8 trades in a row.
تیگنال | ترید سیگنال — Full Track Record
PNL Mama has been tracking تیگنال | ترید سیگنال since . Over the full tracking period, 146 trades were closed, 65 of them in profit (45% all-time win rate), for a total realized P&L of +31 USDT on a flat $100 stake per trade. The all-time maximum drawdown is -1844 USDT on that same stake with a profit factor of 1.01. The 30-day summary above shows current form; the full record shows sample size and trajectory.
تیگنال | ترید سیگنال Trading Style
Across all tracked signals, تیگنال | ترید سیگنال trades 52.44% long and 47.56% short.
How Far تیگنال | ترید سیگنال Trades Get
All-time, only trades whose targets the trader posted. Each target is counted among the trades that had it; SL is trades that hit the stop before any target.
- TP1 — 71% (68 of 96)
- TP2 — 52% (46 of 89)
- TP3 — 35% (31 of 88)
- TP4 — 23% (9 of 40)
- SL — 27% (26 of 96)
Most Traded Pairs by تیگنال | ترید سیگنال
- LINKUSDT — 11 trades
- XRPUSDT — 9 trades
- BTCUSDT — 7 trades
- SUIUSDT — 7 trades
- JCTUSDT — 6 trades
- ENAUSDT — 5 trades
Recent Trades by تیگنال | ترید سیگنال
- BTCUSDT SHORT ×10 — Waiting for entry (18 Nov 2026)
- BTCUSDT SHORT ×10 — +4% (14 Nov 2026)
- MAGMAUSDT LONG ×30 — -44% (05 Nov 2026)
- BTCUSDT LONG ×10 — +16% (01 Nov 2026)
- IDOLUSDT LONG ×30 — Missed (31 Oct 2026)
- BIRBUSDT SHORT ×30 — Missed (30 Oct 2026)
- IDOLUSDT LONG ×30 — +83% (30 Oct 2026)
- 1000PEPEUSDT LONG ×10 — +2% (30 Oct 2026)
- REZUSDT LONG ×10 — -100% (29 Oct 2026)
- OGNUSDT SHORT ×10 — Never opened (28 Oct 2026)
Market outlooks — تیگنال | ترید سیگنال
A view on the market, not a trade. No entry, no result — kept for context, never counted in win rate or rankings.
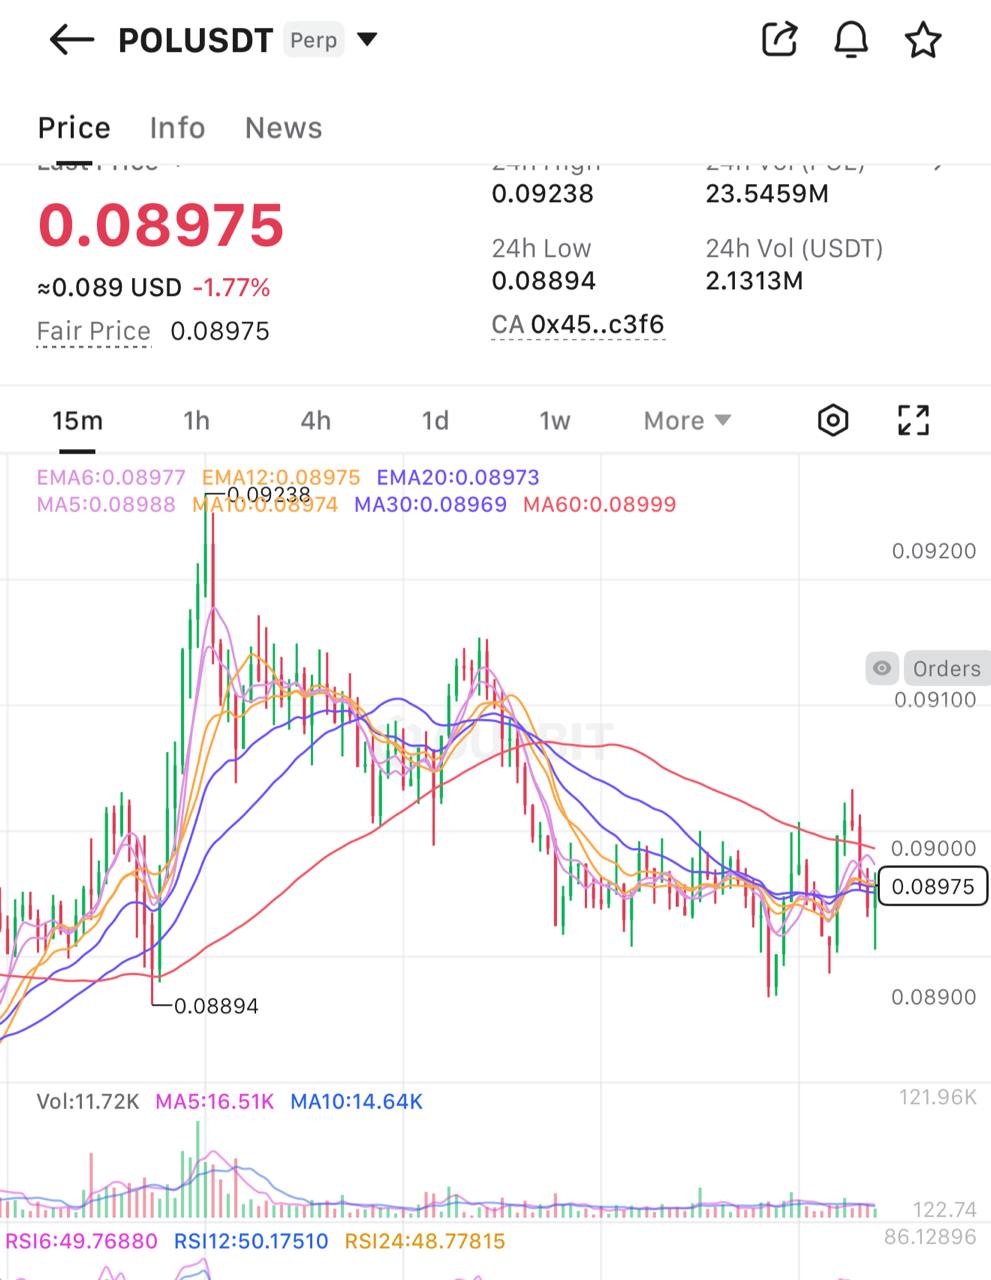
POLUSDT
What تیگنال | ترید سیگنال said
The author asks the community whether to open a long or short position based on the current price.
If price moves up: The author suggests the possibility of opening a long position.
If price moves down: The author suggests the possibility of opening a short position.
Published •
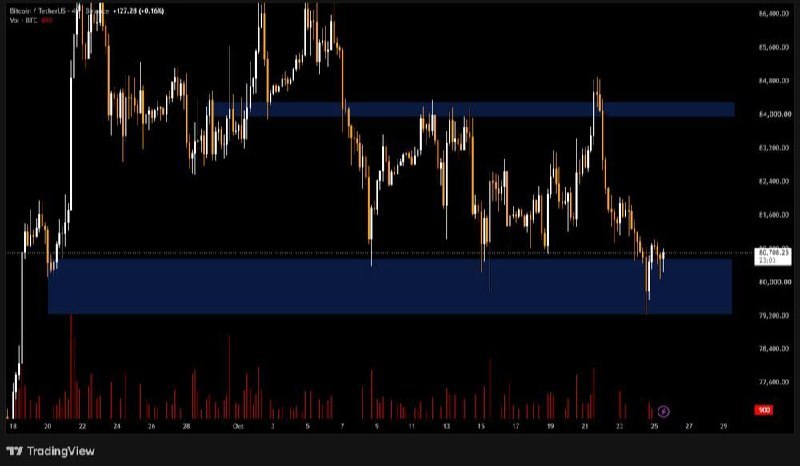
BTCUSDT
What تیگنال | ترید سیگنال said
The current price range for Bitcoin is a critically important support level.
If price moves up: If the current support level holds, the price will be supported.
If price moves down: If this support level is lost, the price could fall to 74000.
Published •
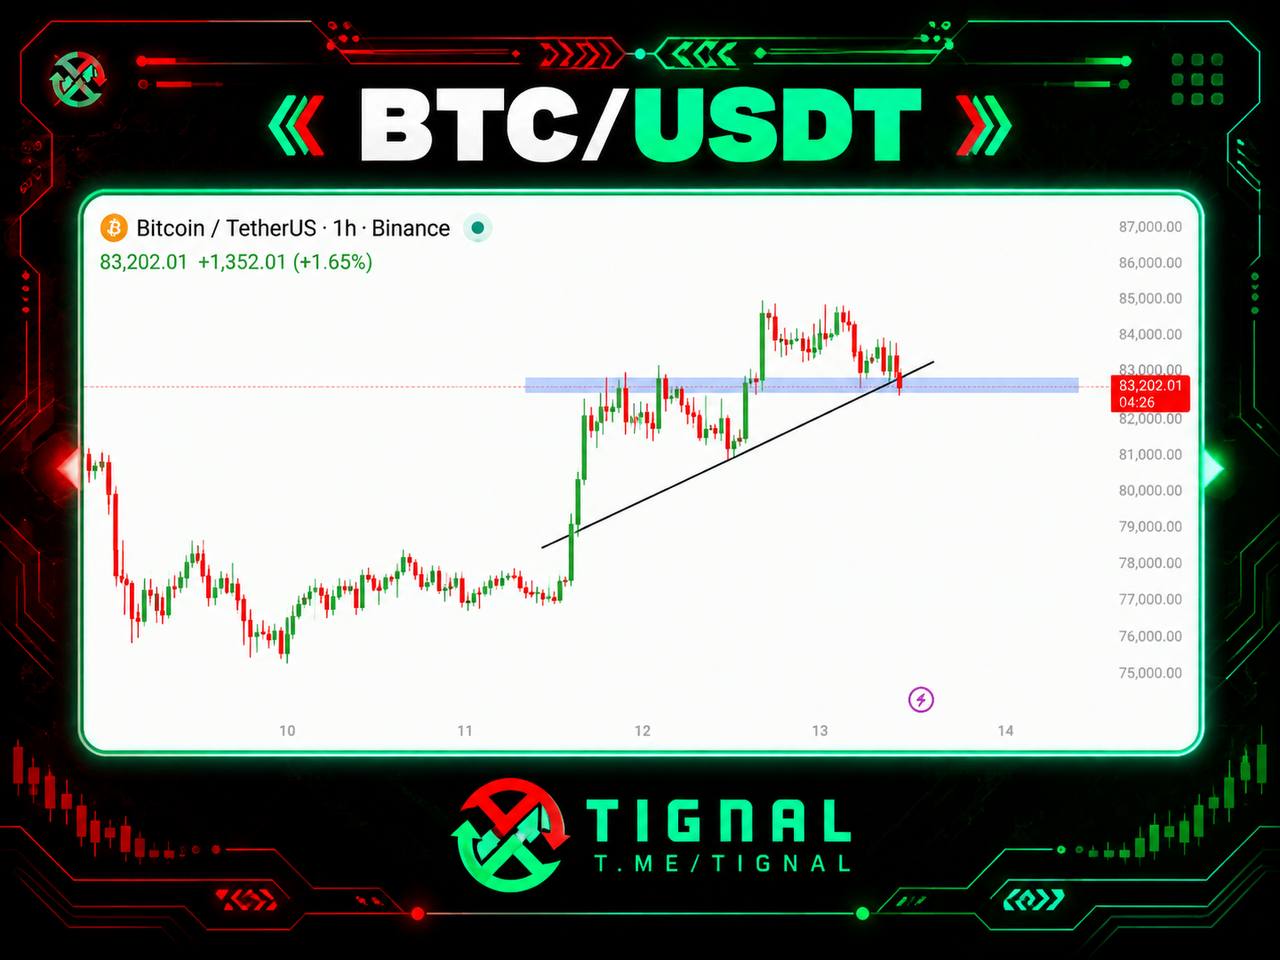
BTCUSDT
What تیگنال | ترید سیگنال said
Bitcoin's price, after a strong rise, has been falling for a while and has now come close to an important blue zone; the market is waiting to see whether the price stays above this zone or goes below it.
If price moves up: If the price stays above the current blue zone → possible reversal and rise again to the upside
If price moves down: If the price goes below this zone → possible continuation of further decline
Published •
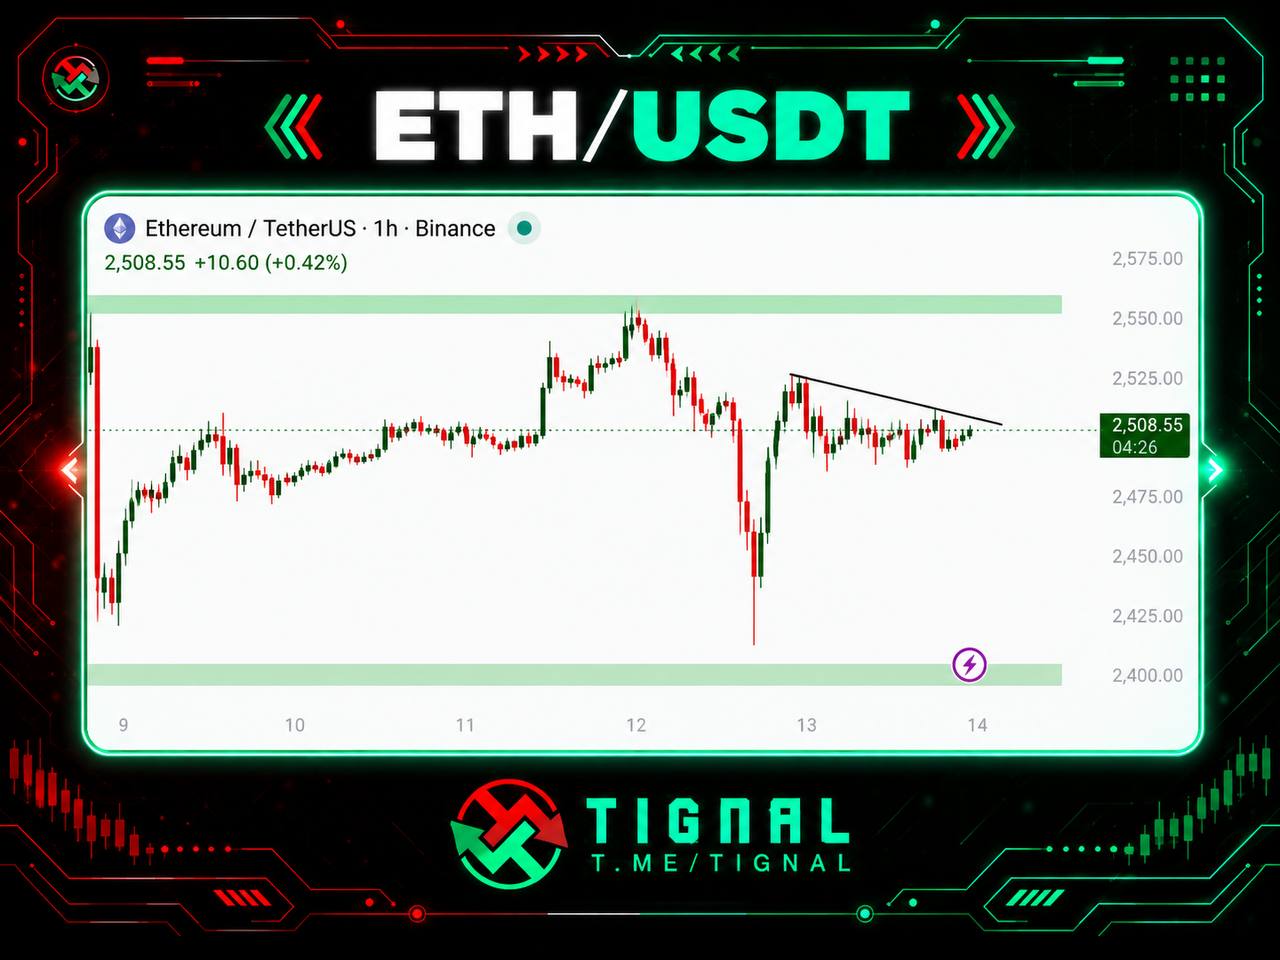
ETHUSDT
What تیگنال | ترید سیگنال said
Ethereum, after a drop, rose from the 2400 to 2405 dollar range and is now fluctuating near 2508 dollars, below the 2530 to 2555 dollar range; the market is waiting for the next direction to become clear.
If price moves up: If the price stays above the 2530 to 2555 dollar range → there is a chance it will move toward higher ranges.
If price moves down: If the price cannot stay above this range and a return downward is confirmed → there is a chance the price correction will continue.
Published •
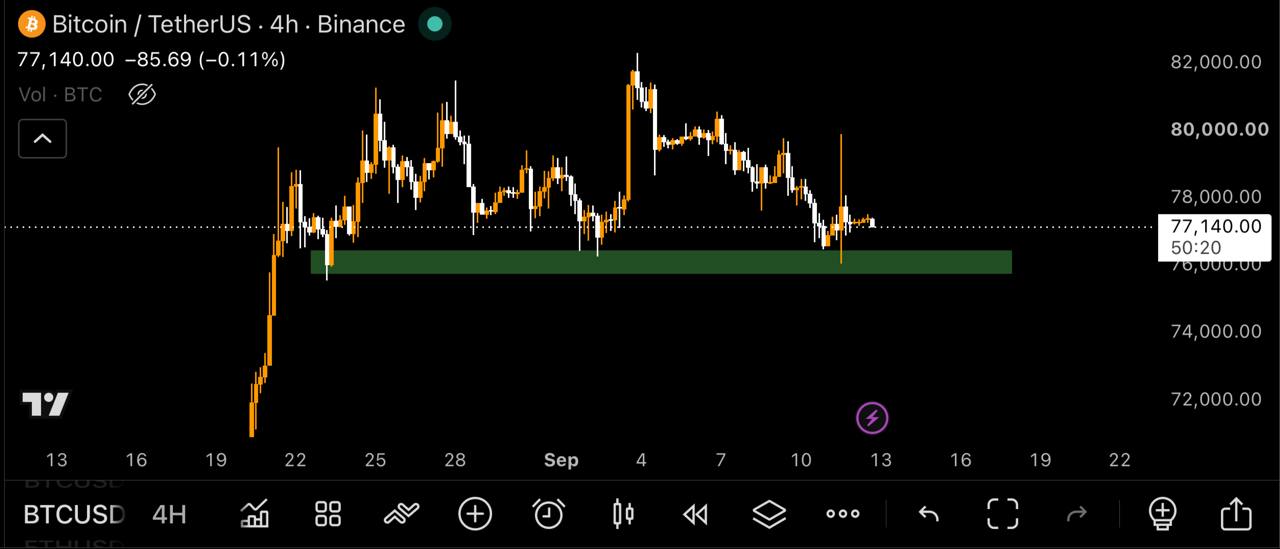
BTCUSDT
What تیگنال | ترید سیگنال said
Price is currently holding above the 76K–76.5K level, which the author considers important. No position is being opened — waiting for price reaction and BTC dominance behavior.
If price moves up: if price remains above 76K–76.5K → rise likely
If price moves down: if price falls below 76K–76.5K → decline likely
Published •
LABUSDT
What تیگنال | ترید سیگنال said
Price is trapped in a broad triangle and approaching a point where direction will soon be decided — until the market chooses a side, it's better to wait for confirmation
If price moves up: if price consolidates above the upper boundary of the triangle → upward movement is likely to start
If price moves down: if price consolidates below the lower boundary of the triangle → downward movement is likely to start

Published •