Kim & Crypto Crypto Signals — Independent Review
Kim & Crypto is a Telegram crypto trading signals channel tracked by PNL Mama. Over the last 30 days this channel published 12 closed trades with an actual win rate of 0%. On a virtual account that puts 10% of its money into every trade and ignores the leverage written in the post, $1000 would have become $921 over 90 days. PNL Mama monitors every signal at the source and publishes the verified track record without edits.
Kim & Crypto — Verified Performance Summary
These results are tracked independently by PNL Mama and computed automatically from Kim & Crypto's published signals against real exchange prices — no edits, no cherry-picking. Of the last 12 closed trades, 0 finished in profit (0% win rate). The worst recorded trade returned -100%, and the average losing trade -76%. At its worst the account was 10.2% below its own peak, the profit factor 0.00, and the longest losing streak 12 trades in a row.
Kim & Crypto — Full Track Record
PNL Mama has been tracking Kim & Crypto since . Over the full tracking period, 54 trades were closed, 12 of them in profit (22% all-time win rate), for a total realized P&L of -1122 USDT on a flat $100 stake per trade. The all-time maximum drawdown is -1187 USDT on that same stake with a profit factor of 0.48. The 30-day summary above shows current form; the full record shows sample size and trajectory.
Kim & Crypto Trading Style
Across all tracked signals, Kim & Crypto trades 80.88% long and 19.12% short.
Most Traded Pairs by Kim & Crypto
- BTCUSDT — 26 trades
- ETHUSDT — 6 trades
- SOLUSDT — 6 trades
- HYPEUSDT — 5 trades
- ETHBTC — 2 trades
- LITUSDT — 2 trades
Recent Trades by Kim & Crypto
- ETHUSDT SHORT ×10 — LIVE -20% (18 Oct 2026)
- ETHBTC LONG ×10 — LIVE -4% (15 Oct 2026)
- ONDOUSDT LONG ×10 — -100% (12 Oct 2026)
- BTCUSDT LONG ×10 — LIVE -30% (12 Oct 2026)
- TSLAUSDT LONG ×10 — -100% (09 Oct 2026)
- BTCUSDT LONG ×10 — LIVE -17% (07 Oct 2026)
- BTCUSDT LONG ×10 — LIVE -58% (02 Oct 2026)
- ETHBTC LONG ×10 — -100% (30 Sep 2026)
- PENGUUSDT LONG ×10 — -100% (30 Sep 2026)
- BTCUSDT LONG ×10 — LIVE -32% (29 Sep 2026)
Market Outlook — Kim & Crypto's market view
A view on the market, not a trade. No entry, no result — kept for context, never counted in win rate or rankings.
ETHUSDT
What Kim & Crypto said
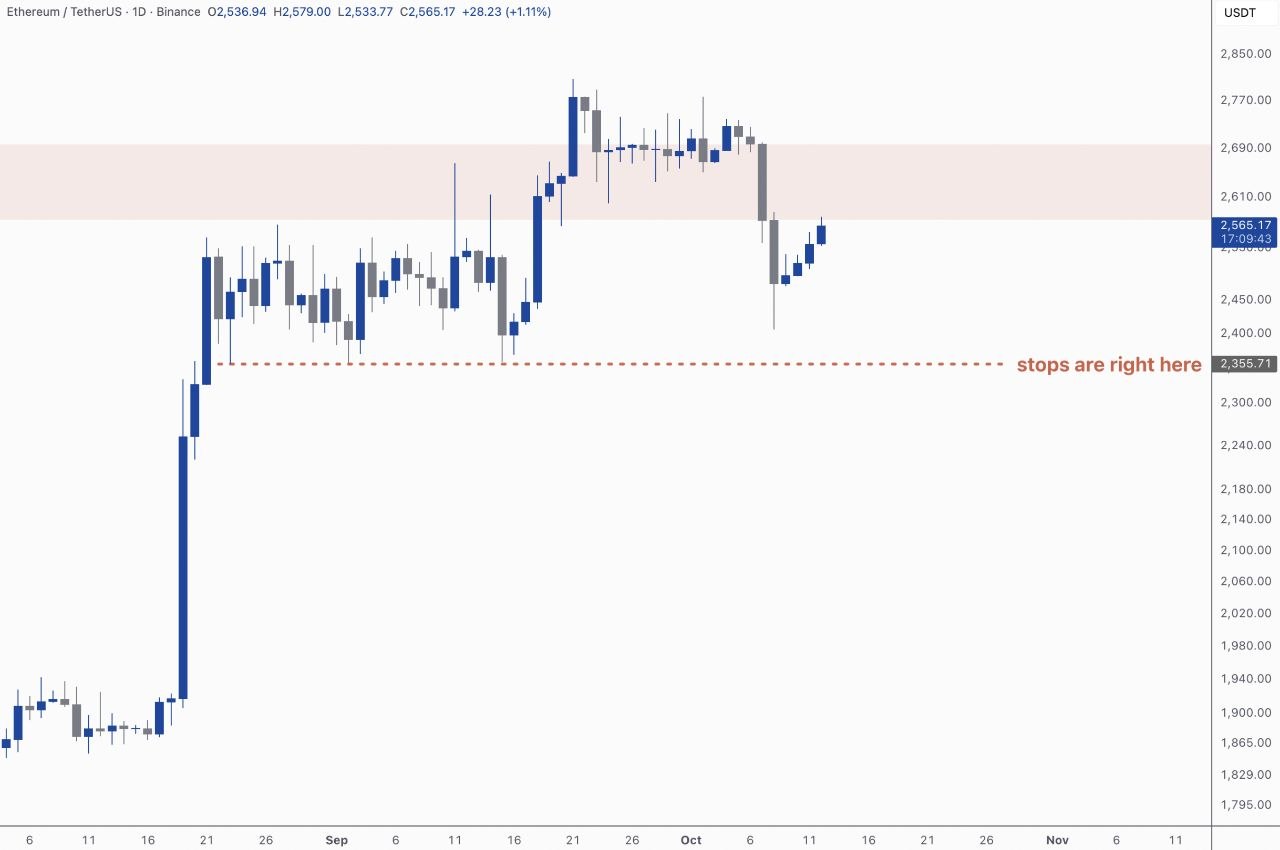
Ethereum is trading around 2,566 after climbing back from 2,450. The author is not very confident about a bigger move up, because a lot of traders' exit orders are sitting below 2,350, and he says he is ready for any outcome.
If price moves down: if the price drops below 2,350, those waiting orders below that level could be filled, opening the way for a sharp move down
Published •
BTCUSDT
What Kim & Crypto said
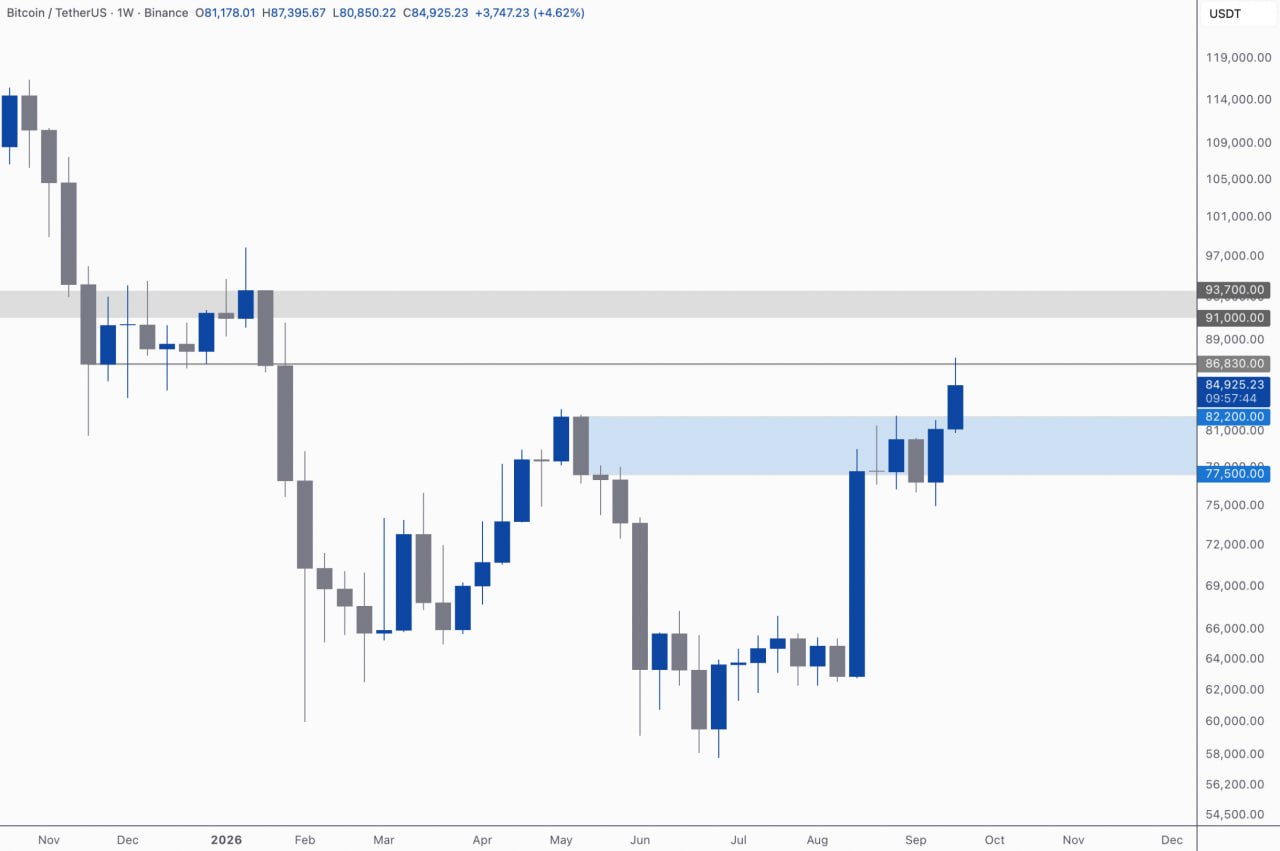
Bitcoin ended the week well above $82,200, so the price is likely moving into a new, higher range. Above the current price sit the levels $87,000 and then $91,000-$94,000, which have recently stopped the price from rising; only above them would Bitcoin get back to its record highs.
If price moves up: if the price climbs above $87,000 and then holds above the $91,000-$94,000 area → a move toward new record highs becomes likely
What the market answered
Market: The analyst expected a rise — the move started, result pending.
Automatically verified against exchange data.
Published •
BTCUSDT
What Kim & Crypto said
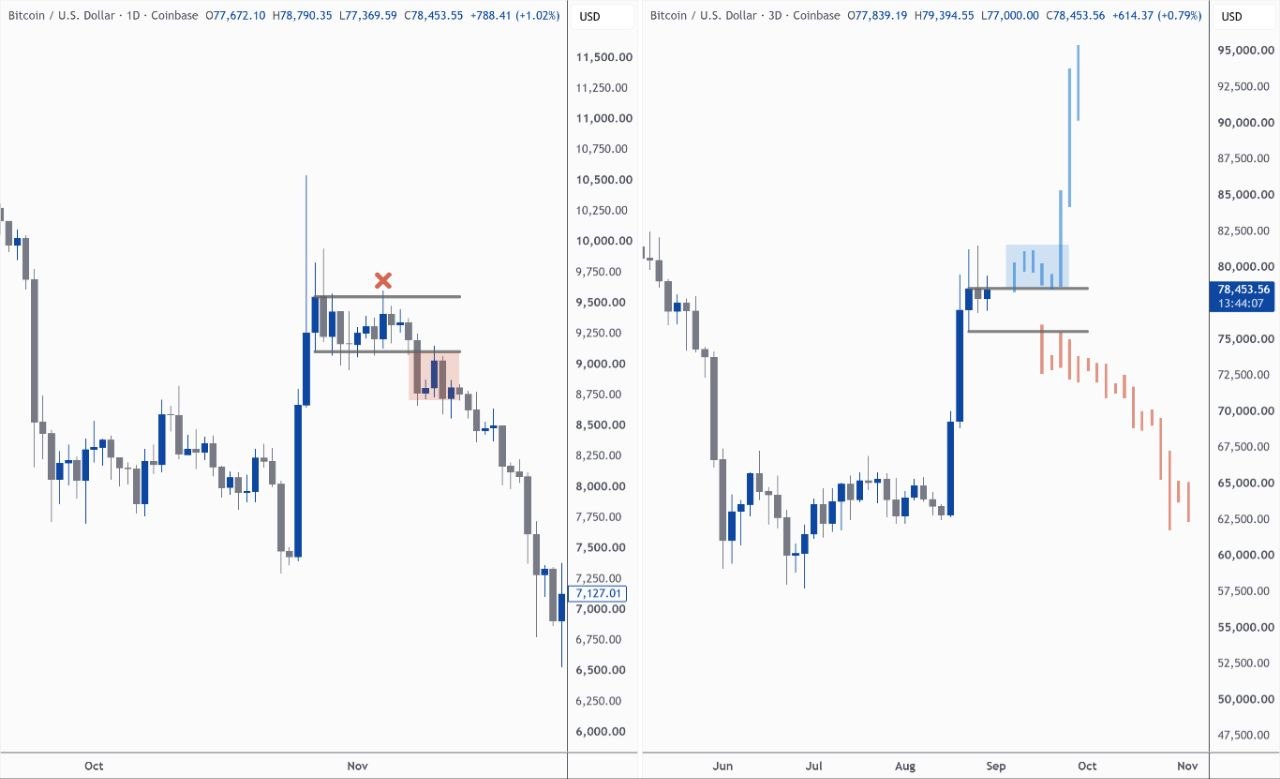
Bitcoin recently rallied sharply and is now moving sideways near its recent local highs. The market stands at a crossroads, and the next move will decide whether the rally extends or rolls over.
If price moves up: if the price climbs back above $80k → likely another push into new local highs
If price moves down: if the price stays close to $77k or drops lower → significant risk of a sharp reversal, repeating a past pump-and-dump pattern
Published •
BTCUSDT
What Kim & Crypto said
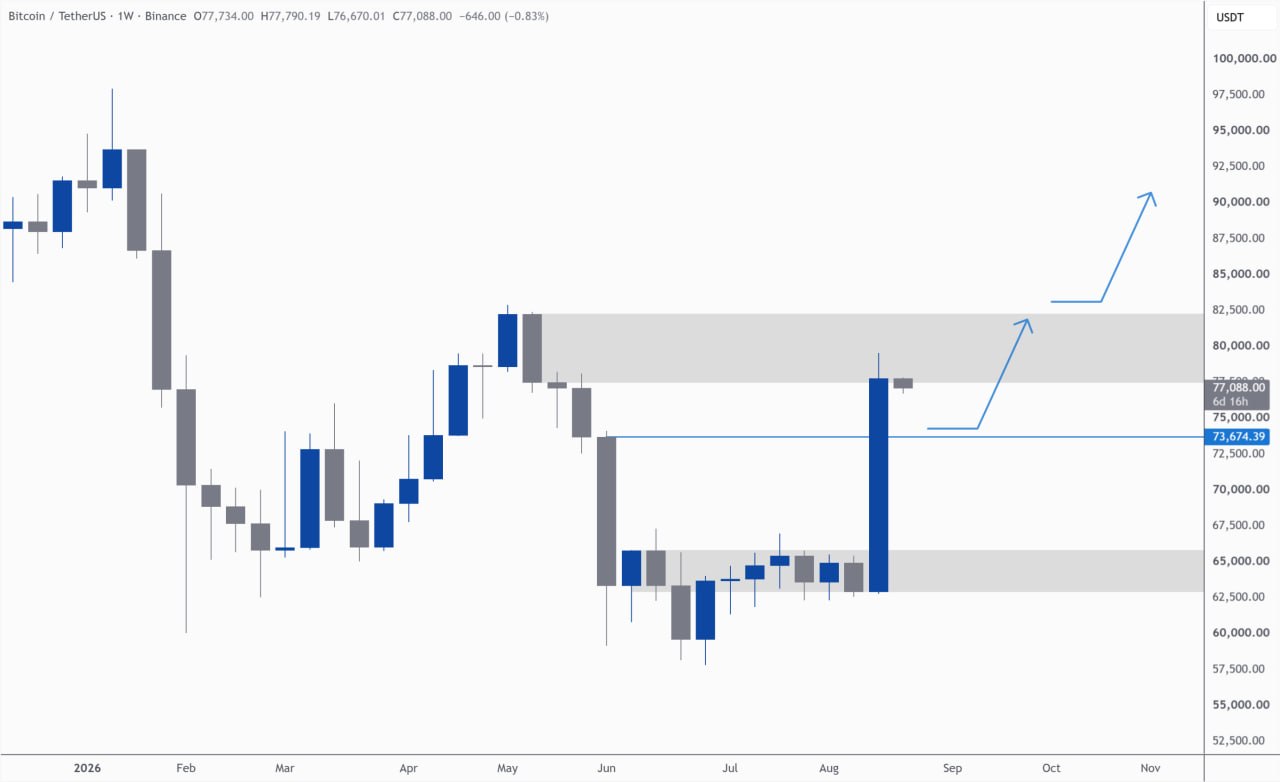
Bitcoin recently jumped higher and is now holding above $74,000. The mood across crypto is upbeat, though the price may take a breather and drift sideways for a while. A key ceiling where sellers have historically stepped in sits around $80,000-$82,500.
If price moves up: If Bitcoin stays above $74,000, buyers are likely in control and the price could push toward $80,000-$82,500, with potential to climb further
If price moves down: If Bitcoin drops and trades below the blue line near $73,000, the picture turns worrying and a deeper decline becomes likely
Published •
BTCUSDT
What Kim & Crypto said
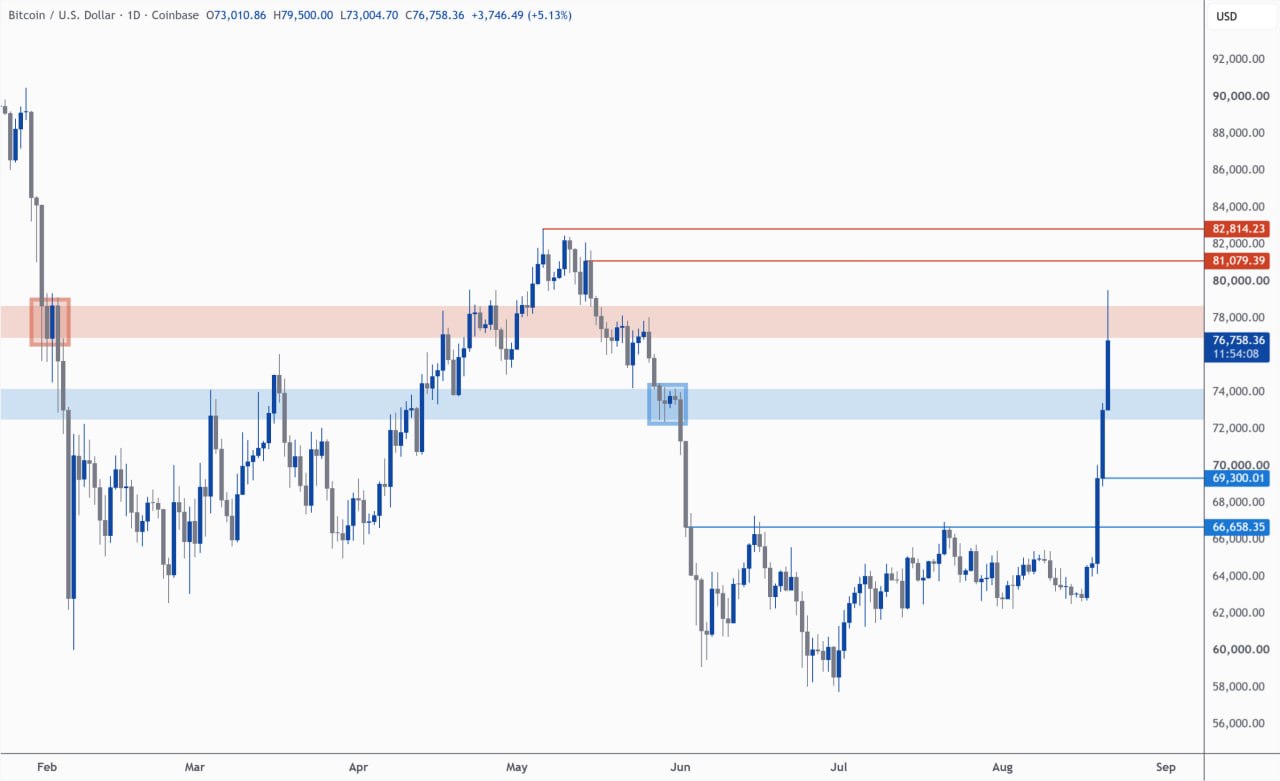
Bitcoin recently jumped higher and is now trading around 76,700. The chart marks several important price levels where the price has reacted before — blue ones below and red ones above.
If price moves up: If the price drops back to any of the blue levels (around 74,000–75,000, 70,000, 68,200, or 66,500), it could be a chance to buy, with potential upside toward the red levels around 81,700–83,900.
If price moves down: If the price falls below the blue zone, further downside becomes likely.
Published •
BTCUSDT
What Kim & Crypto said
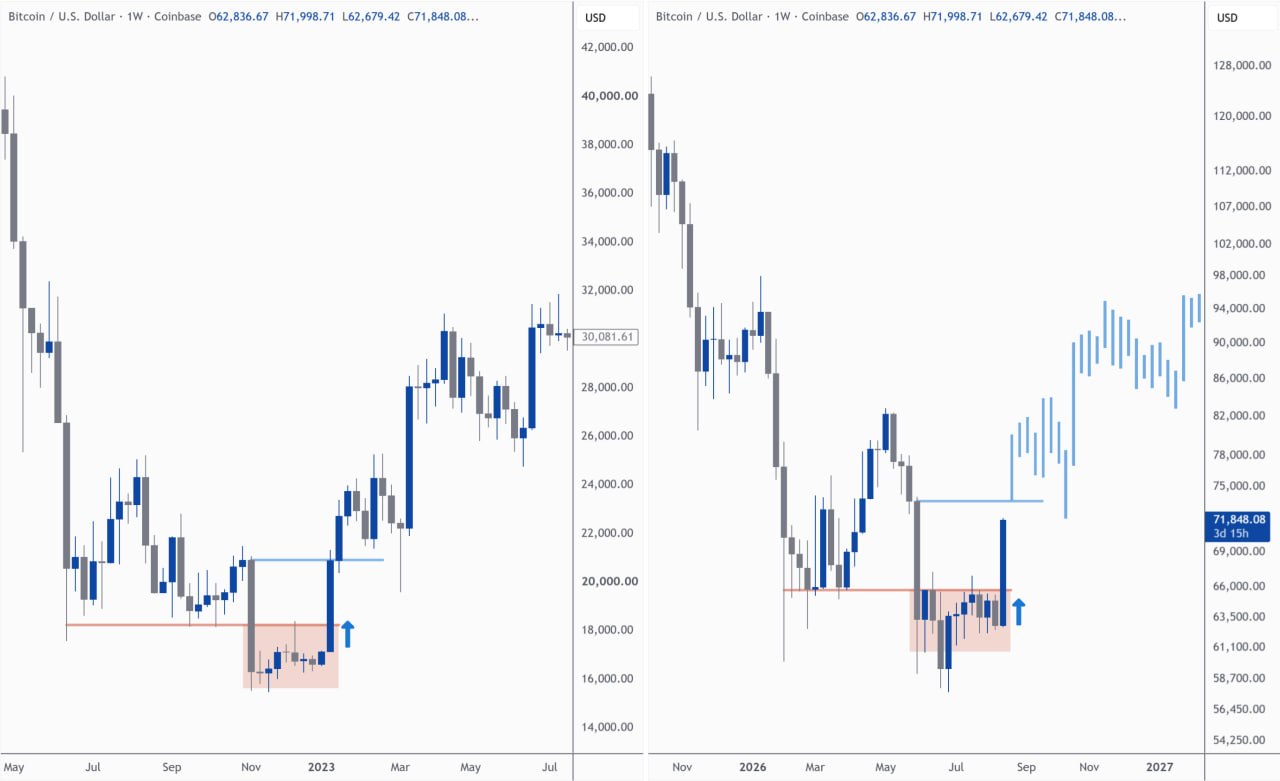
Bitcoin sharply rose, many short positions were liquidated, and the price moved above local levels. The author does not yet consider this the start of a new major rally — we need to wait for confirmation of a weekly close above 74,000; otherwise, the rise may turn out to be just a rebound before continuing the decline.
If price moves up: if the price holds above 74,000 on the weekly close → the 2022-2023 model will play out and we can talk about the end of the downtrend
If price moves down: if the price does not hold above 74,000 and does not reclaim the global level → the rise may be false, and the market will continue to decline
What the market answered
Market: Price closed above 74000 — over 5 days after the break it rose 6.2% — the move continued.
Automatically verified against exchange data.
Published •