Fed Russian Insiders Crypto Signals — Independent Review
Fed Russian Insiders is a Telegram crypto trading signals channel tracked by PNL Mama. Over the last 30 days this channel published 0 closed trades with an actual win rate of 0%. On a virtual account that puts 10% of its money into every trade and ignores the leverage written in the post, $1000 would have become $1 089 over 90 days. PNL Mama monitors every signal at the source and publishes the verified track record without edits.
Fed Russian Insiders — Verified Performance Summary
These results are tracked independently by PNL Mama and computed automatically from Fed Russian Insiders's published signals against real exchange prices — no edits, no cherry-picking. At its worst the account was 2.3% below its own peak.
Fed Russian Insiders — Full Track Record
PNL Mama has been tracking Fed Russian Insiders since . Over the full tracking period, 26 trades were closed, 18 of them in profit (69% all-time win rate), for a total realized P&L of +667 USDT on a flat $100 stake per trade. The all-time maximum drawdown is -177 USDT on that same stake with a profit factor of 2.67. The 30-day summary above shows current form; the full record shows sample size and trajectory.
Fed Russian Insiders Trading Style
Across all tracked signals, Fed Russian Insiders trades 100.00% long and 0.00% short.
Most Traded Pairs by Fed Russian Insiders
- UNIUSDT — 3 trades
- ZECUSDT — 3 trades
- BNBUSDT — 2 trades
- LSKUSDT — 2 trades
- VELODROMEUSDT — 2 trades
- 4USDT — 1 trade
Recent Trades by Fed Russian Insiders
- UNIUSDT LONG ×10 — +32% (17 Sep 2026)
- ZECUSDT LONG ×10 — +6% (16 Sep 2026)
- ICPUSDT LONG ×10 — +25% (08 Sep 2026)
- TRXUSDT LONG — Never opened (07 Sep 2026)
- UNIUSDT LONG ×10 — -7% (06 Sep 2026)
- DASHUSDT LONG ×10 — +62% (05 Sep 2026)
- ARBUSDT LONG ×10 — +92% (03 Sep 2026)
- ETCUSDT LONG ×10 — -74% (27 Aug 2026)
- ZECUSDT LONG ×10 — +43% (24 Aug 2026)
- BTCUSDT LONG ×10 — +59% (21 Aug 2026)
Market Outlook — Fed Russian Insiders's market view
A view on the market, not a trade. No entry, no result — kept for context, never counted in win rate or rankings.
BTCUSDT
What Fed Russian Insiders said
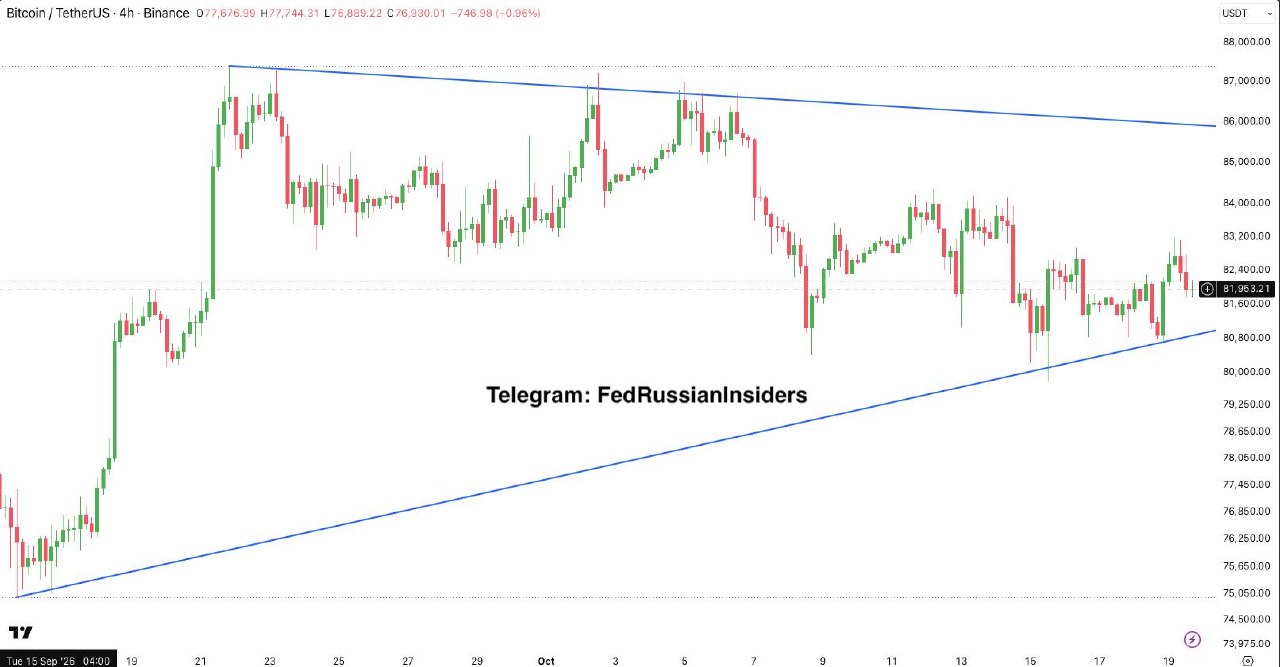
Bitcoin is trading near $81,953, stuck in a slowly narrowing band between about $80,700 and $82,900, and the market is waiting to see which way it will finally move.
If price moves up: if price gets above $83,200 → a move up toward $84,000 looks likely, and $86,000 is the next level above that
If price moves down: if price drops below $80,800 → the floor gives way and $80,000 and $79,250 come into play below
Published •
ARBUSDT
What Fed Russian Insiders said
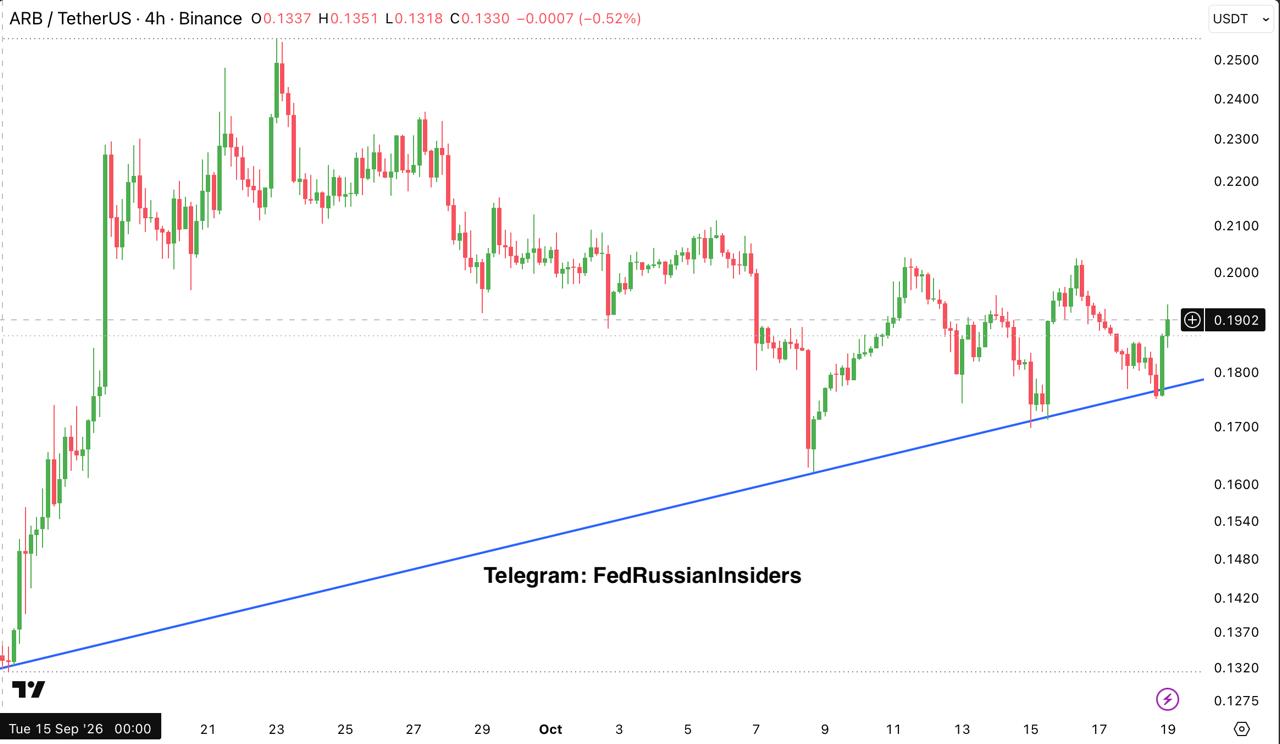
ARB is trading near 0.1902 after a long climb in which every dip was bought at a slightly higher level than the last, while sellers keep pushing the price back down near 0.2000 — the market is squeezed into a narrowing range and is about to pick a direction.
If price moves up: if price rises above 0.2000 → likely move up toward 0.2100, with 0.2200 above that
If price moves down: if price falls below 0.1800 → likely drop back toward 0.1780, with 0.1700 below that
Published •
LTCUSDT
What Fed Russian Insiders said
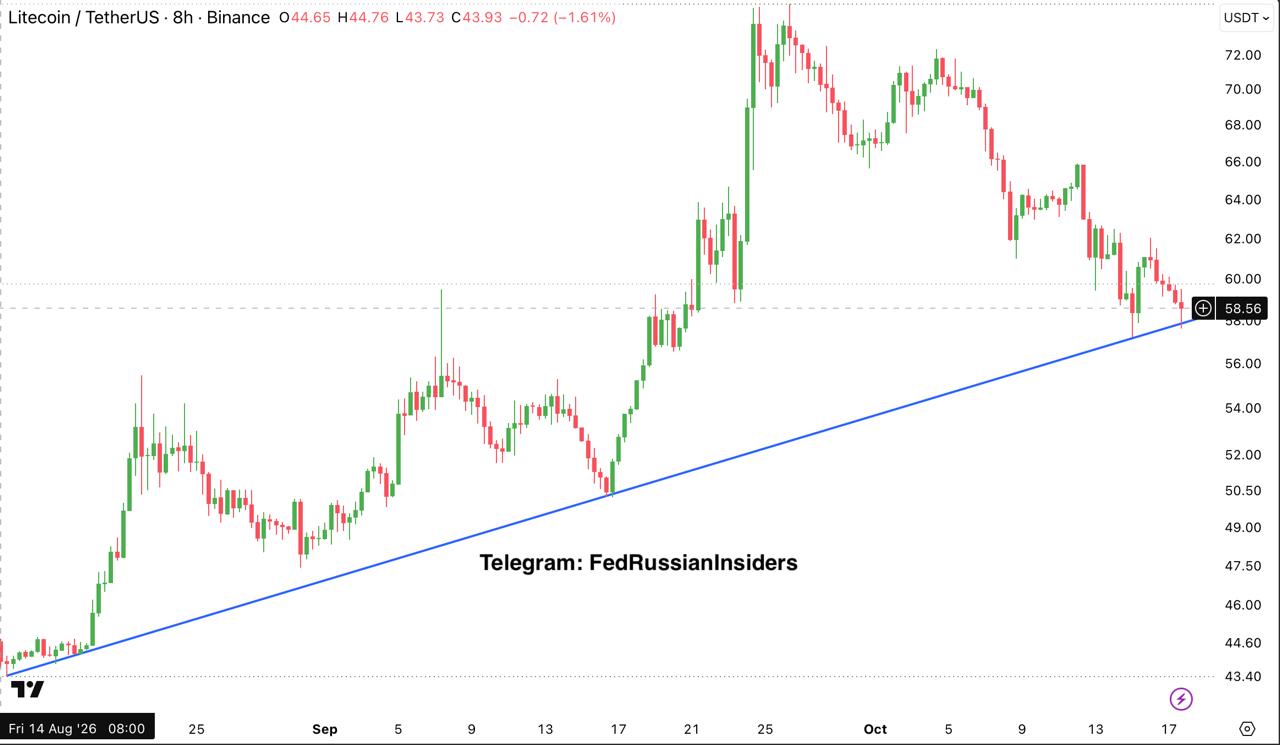
Litecoin is trading around 58.56, sitting right on a long upward-sloping line that has guided the price up from 43.40; buyers and sellers are now fighting over which way it goes next.
If price moves up: if price climbs back above 60 → likely push up toward 62, with 64 above that
If price moves down: if price falls below 57.50 → the long rising line gives way, with 56 and 54 below
Published •
BCHUSDT
What Fed Russian Insiders said
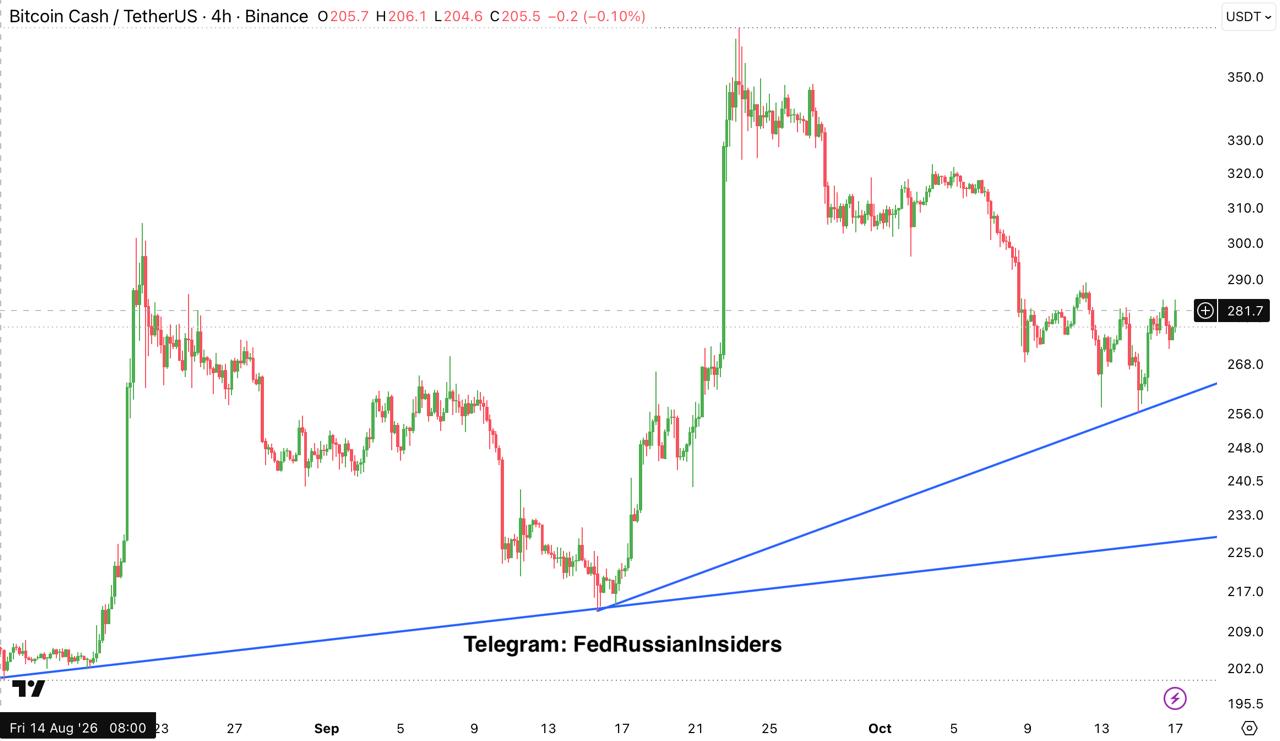
Bitcoin Cash sits near $281 after climbing from the September low around $215; for now the price is moving inside a narrow band between $268 and $288, with the lows slowly getting higher and pressure building up under $288.
If price moves up: if the price rises above $288 → a move up to $300 looks likely, with $310 above it
If price moves down: if the price falls below $268 → a slide back to about $260 is likely, and $228 is the last level that could stop a deeper decline
Published •
SOLUSDT
What Fed Russian Insiders said
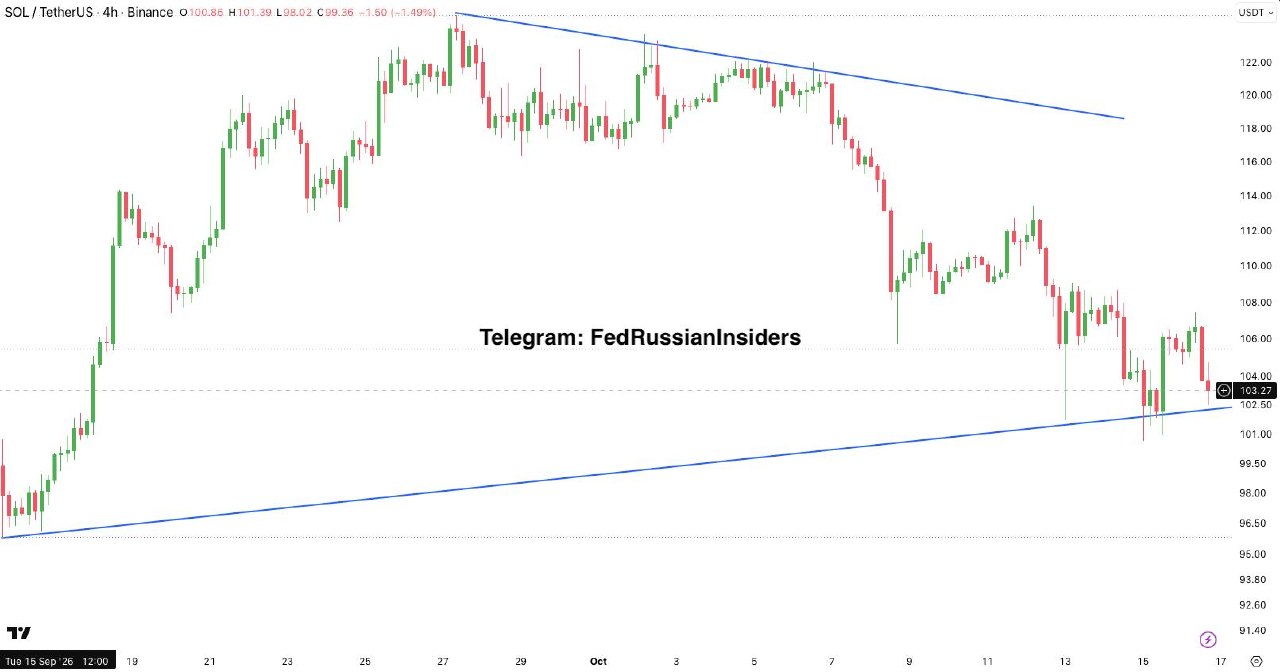
Цена держится около 103.27 и уже третий раз подходит к отметке 101, от которой покупатели раньше откупали, а сверху давит линия, идущая от 124.50 — рынок зажат между этими границами и готовится выбрать сторону.
If price moves up: если цена вернётся выше 106 → возможен рост к 108, а затем к 112
If price moves down: если цена уйдёт ниже 101 → вероятно снижение к 98 и 95
Published •
UNIUSDT
What Fed Russian Insiders said
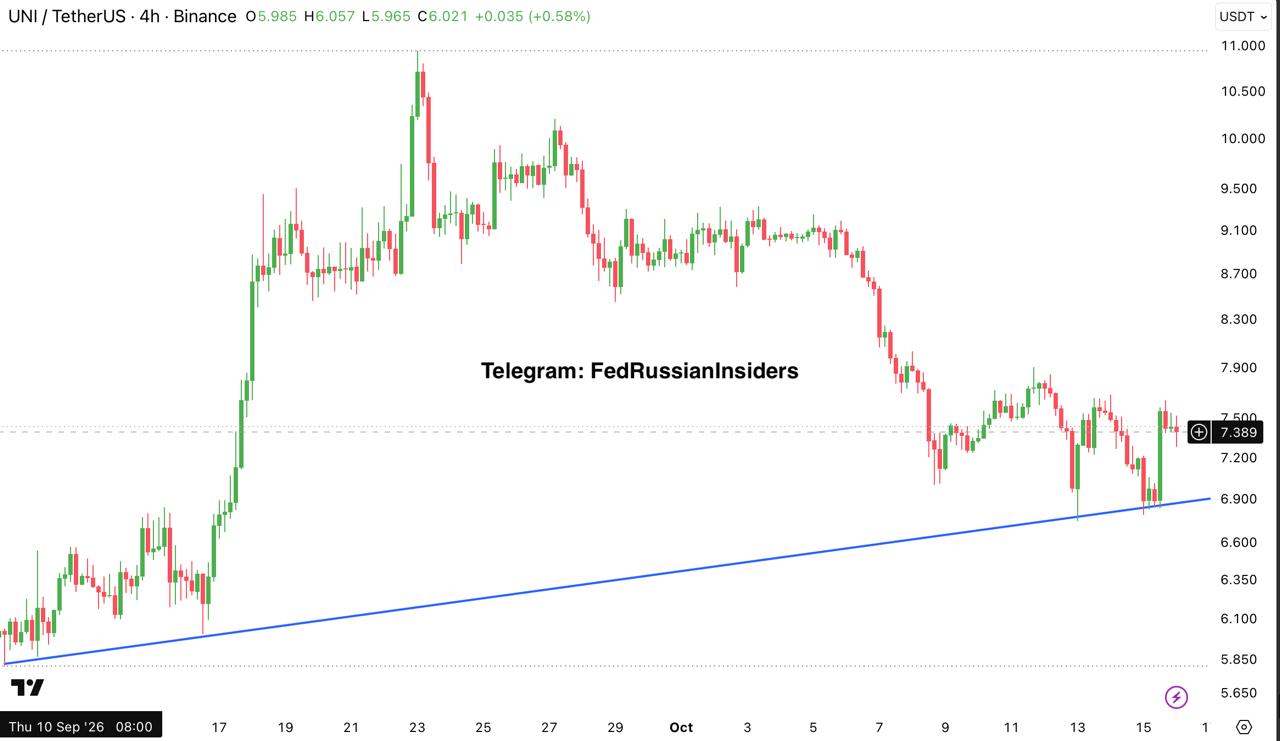
После падения с октябрьских максимумов цена держится около $7.39 и пытается остановить снижение у линии растущих минимумов, идущей от $5.85; при этом область $7.20–$7.90 удерживает цену с 8 октября, и покупатели пока дважды защитили эту зону.
If price moves up: если цена поднимется выше $7.60 → возможен рост к $7.90, а выше — к $8.30
If price moves down: если цена опустится ниже $7.20 → вероятно снижение к $6.90
Published •