Bitcoin Bullets® Crypto Signals — Independent Review
Bitcoin Bullets® is a Telegram crypto trading signals channel tracked by PNL Mama. Over the last 30 days this channel published 1 closed trades with an actual win rate of 100%. On a virtual account that puts 10% of its money into every trade and ignores the leverage written in the post, $1000 would have become $1 052 over 90 days. PNL Mama monitors every signal at the source and publishes the verified track record without edits.
Bitcoin Bullets® — Verified Performance Summary
These results are tracked independently by PNL Mama and computed automatically from Bitcoin Bullets®'s published signals against real exchange prices — no edits, no cherry-picking. Of the last 1 closed trades, 1 finished in profit (100% win rate). The worst recorded trade returned 41%. At its worst the account was 1.3% below its own peak.
Bitcoin Bullets® — Full Track Record
PNL Mama has been tracking Bitcoin Bullets® since . Over the full tracking period, 18 trades were closed, 9 of them in profit (50% all-time win rate), for a total realized P&L of +163 USDT on a flat $100 stake per trade. The all-time maximum drawdown is -236 USDT on that same stake with a profit factor of 1.34. The 30-day summary above shows current form; the full record shows sample size and trajectory.
Bitcoin Bullets® Trading Style
Across all tracked signals, Bitcoin Bullets® trades 90.91% long and 9.09% short.
Most Traded Pairs by Bitcoin Bullets®
- BTCUSDT — 2 trades
- ETHUSDT — 2 trades
- LSKUSDT — 2 trades
- TONUSDT — 2 trades
- VELODROMEUSDT — 2 trades
- 4USDT — 1 trade
Recent Trades by Bitcoin Bullets®
- BTCUSDT LONG ×10 — +41% (21 Sep 2026)
- DRIFTUSDT LONG ×10 — +44% (21 Aug 2026)
- LSKUSDT LONG ×10 — -99% (12 Aug 2026)
- LSKUSDT LONG ×4 — +64% (11 Aug 2026)
- VELODROMEUSDT LONG ×4 — +60% (10 Aug 2026)
- MAVIAUSDT LONG ×4 — -52% (28 Jul 2026)
- 4USDT LONG ×4 — +2% (26 Jul 2026)
- BTRUSDT LONG ×4 — +142% (22 Jul 2026)
- CHILLGUYUSDT LONG ×4 — Missed (21 Jul 2026)
- BULLAUSDT LONG ×4 — +175% (17 Jul 2026)
Market Outlook — Bitcoin Bullets®'s market view
A view on the market, not a trade. No entry, no result — kept for context, never counted in win rate or rankings.
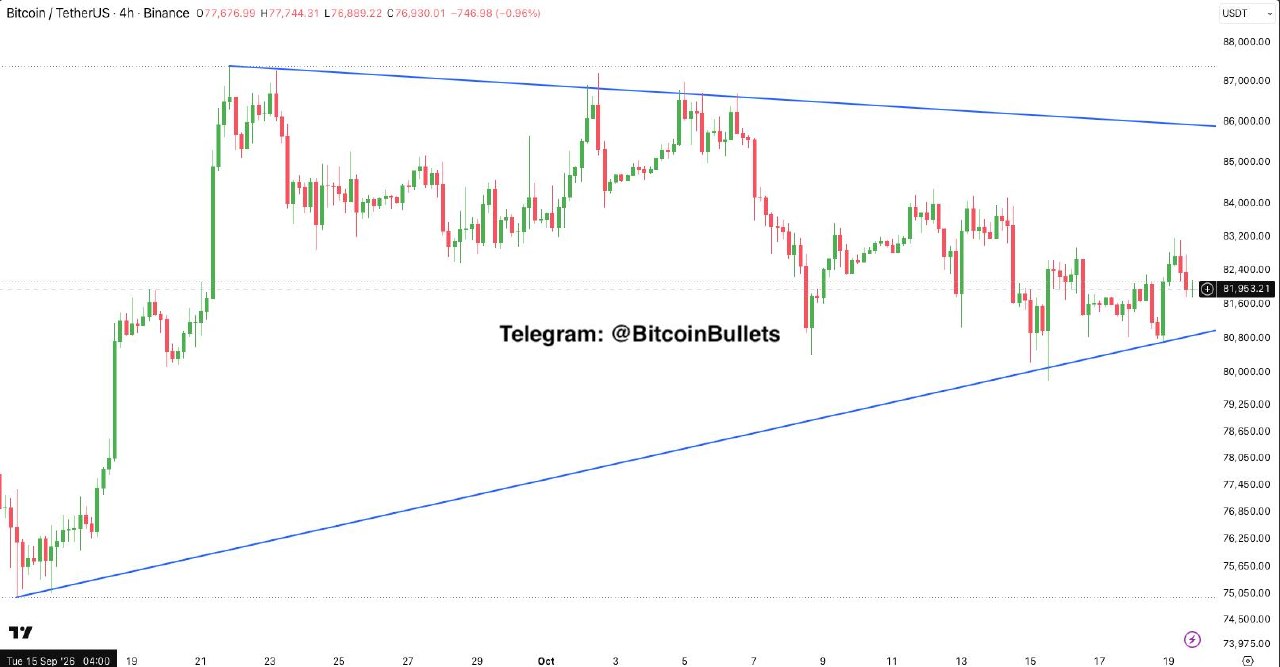
BTCUSDT
What Bitcoin Bullets® said
Bitcoin is trading near 81,953 and has been moving sideways inside a narrowing band between roughly 80,900 and 82,800, with the price currently sitting in the lower part of that band.
If price moves up: if the price rises above 82,800 and then above 84,000 → a move toward 86,000 becomes possible
If price moves down: if the price falls below 80,900 → a drop to 80,000 and then toward 78,000 becomes possible
Published •
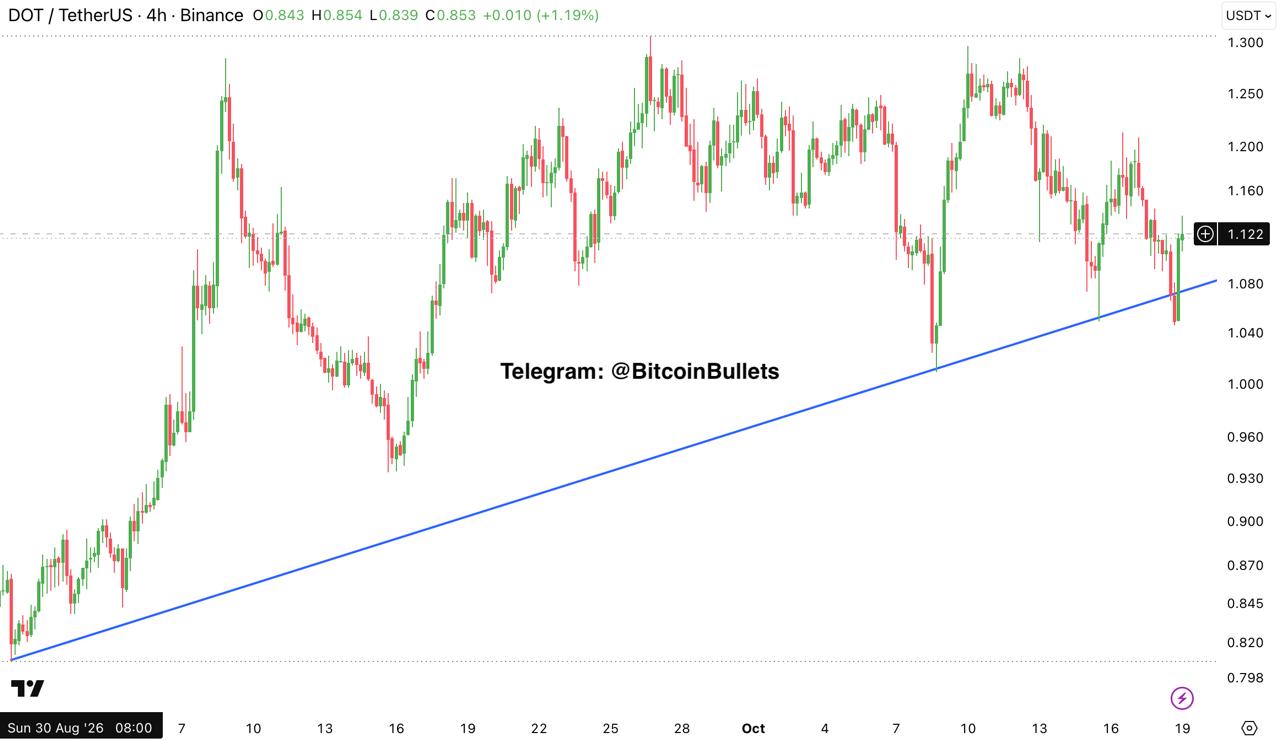
DOTUSDT
What Bitcoin Bullets® said
DOT is trading at 1.122 after buyers quickly pushed the price back up from a brief dip below the upward-sloping line that has been guiding the rise since late August — this is the third time this month that line has been defended.
If price moves up: if price rises above 1.160 → likely move toward 1.200, with a path back to the 1.250-1.300 area
If price moves down: if price falls below 1.080 → likely drop toward 1.000 and the September low at 0.930
Published •
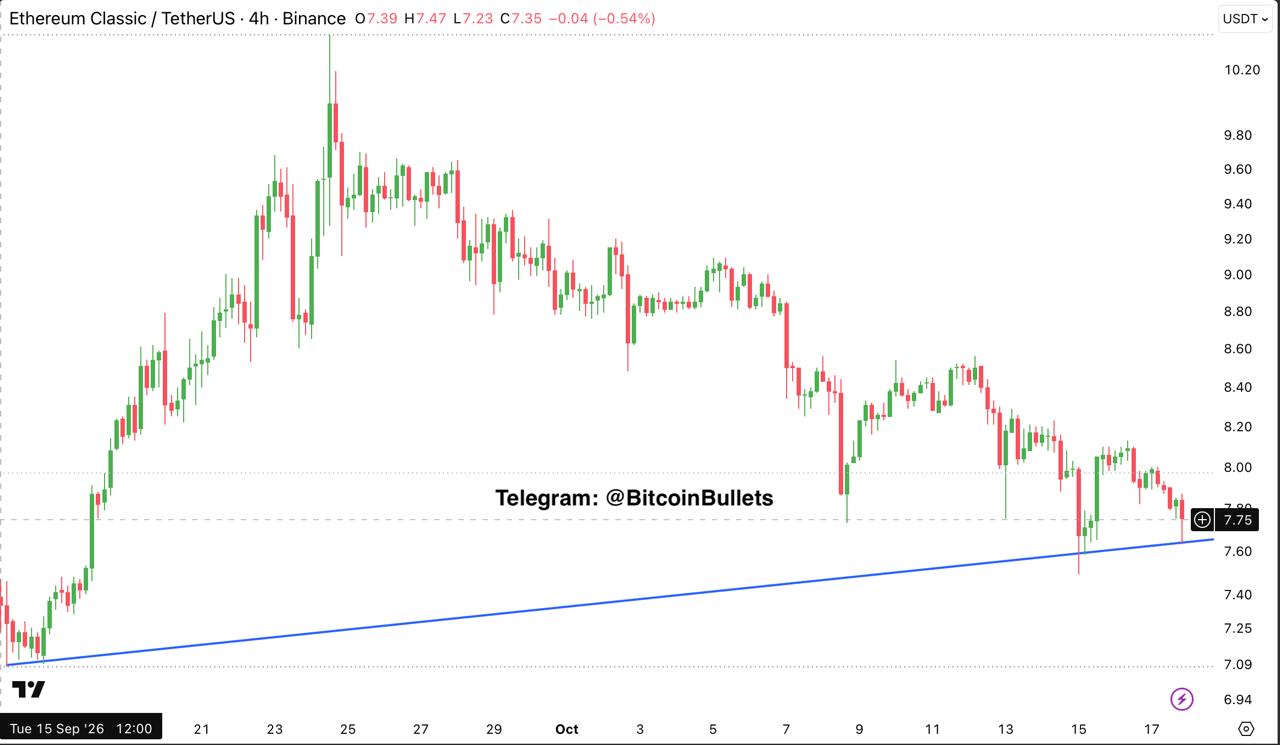
ETCUSDT
What Bitcoin Bullets® said
ETC is trading around 7.75, well below the 10.20 high reached earlier, and has come back down to the 7.65 area that turned the price upward in mid-September. That area pushed price up to 8.10 last time, but the rise did not last and price is sitting on it again.
If price moves up: if price stays above 7.65 and climbs back over 8.00 → a move up toward 8.20 and then the 8.40 area becomes likely
If price moves down: if price drops under 7.60 → a fall toward 7.40 and the 7.09 level from September becomes likely
Published •
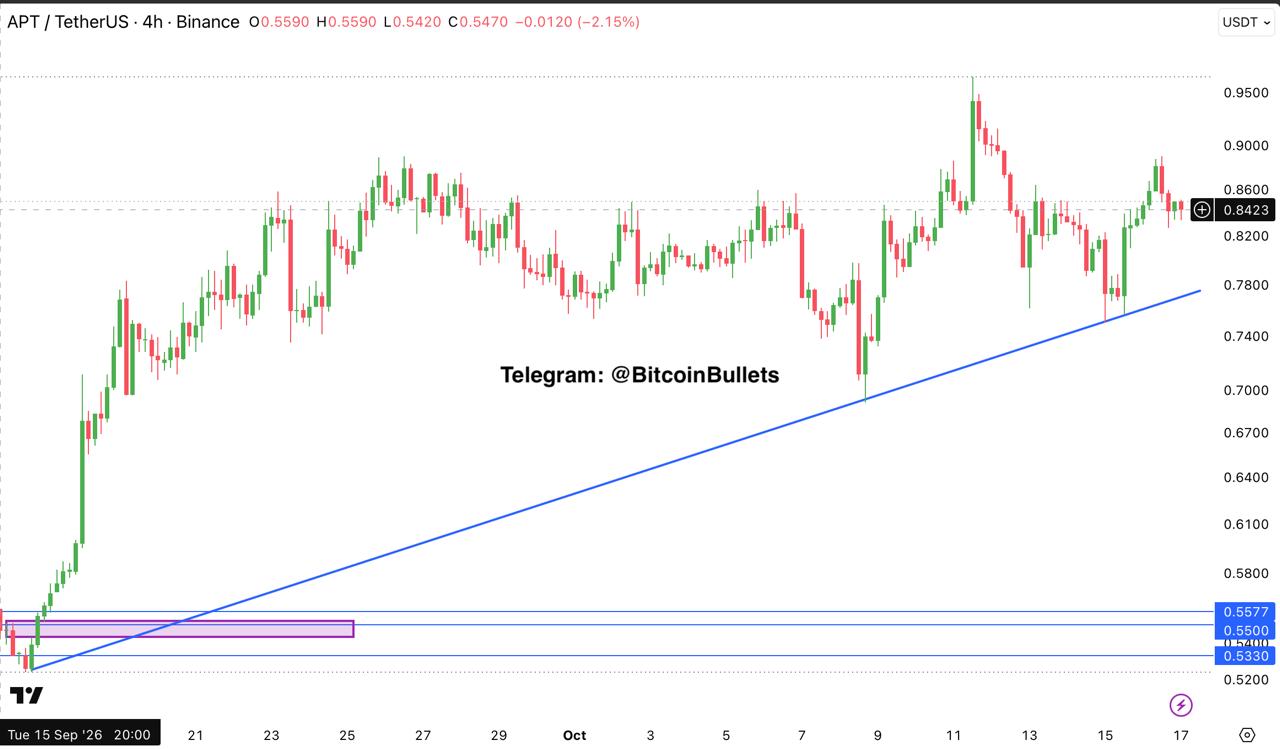
APTUSDT
What Bitcoin Bullets® said
APT trades at 0.8423, just below 0.86, after buyers earlier pushed it up to 0.88; dips toward the rising level drawn from the mid-September lows have been bought each time, and the zone around 0.53-0.56 is where the move originally started.
If price moves up: if price rises above 0.86 and then clears 0.88 → a move toward 0.90 and later the 0.97 highs looks likely
If price moves down: if price falls below 0.82 → a decline toward roughly 0.78 is likely
Published •
TRXUSDT
What Bitcoin Bullets® said
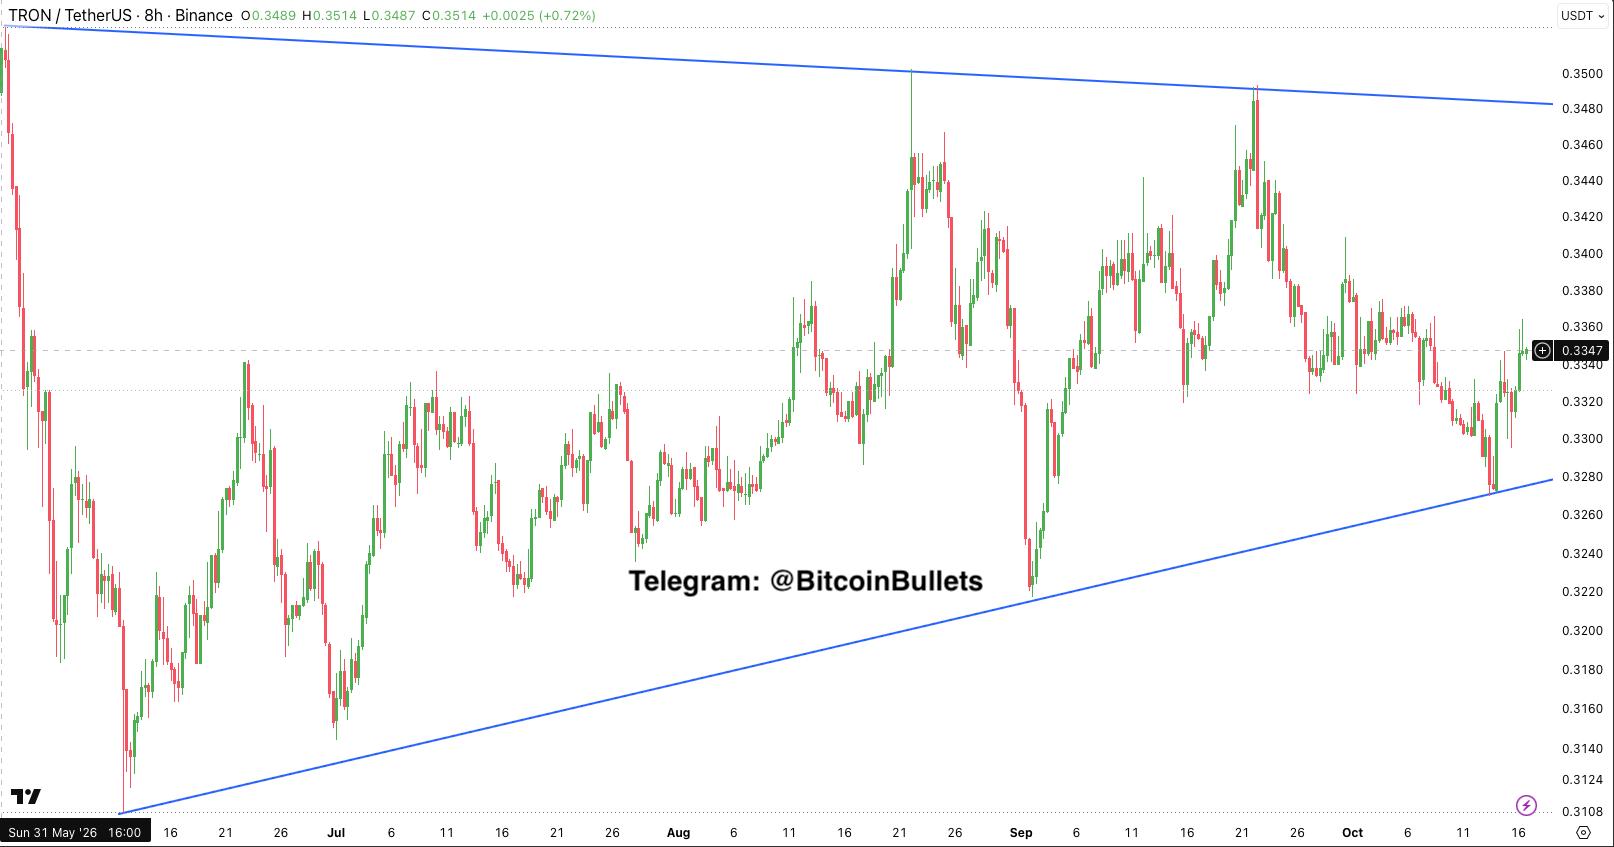
TRX is around 0.3347 right now, after bouncing up from the line it has been climbing along since the June lows near 0.3270. Price is squeezed in a narrow band between 0.3480 above and about 0.3280 below, so the market is close to choosing a direction.
If price moves up: If price rises above 0.3360 → a move toward 0.3400 and then 0.3480 looks likely.
If price moves down: If price turns down and falls below 0.3320 → another drop toward 0.3280 looks likely.
Published •
AVAXUSDT
What Bitcoin Bullets® said
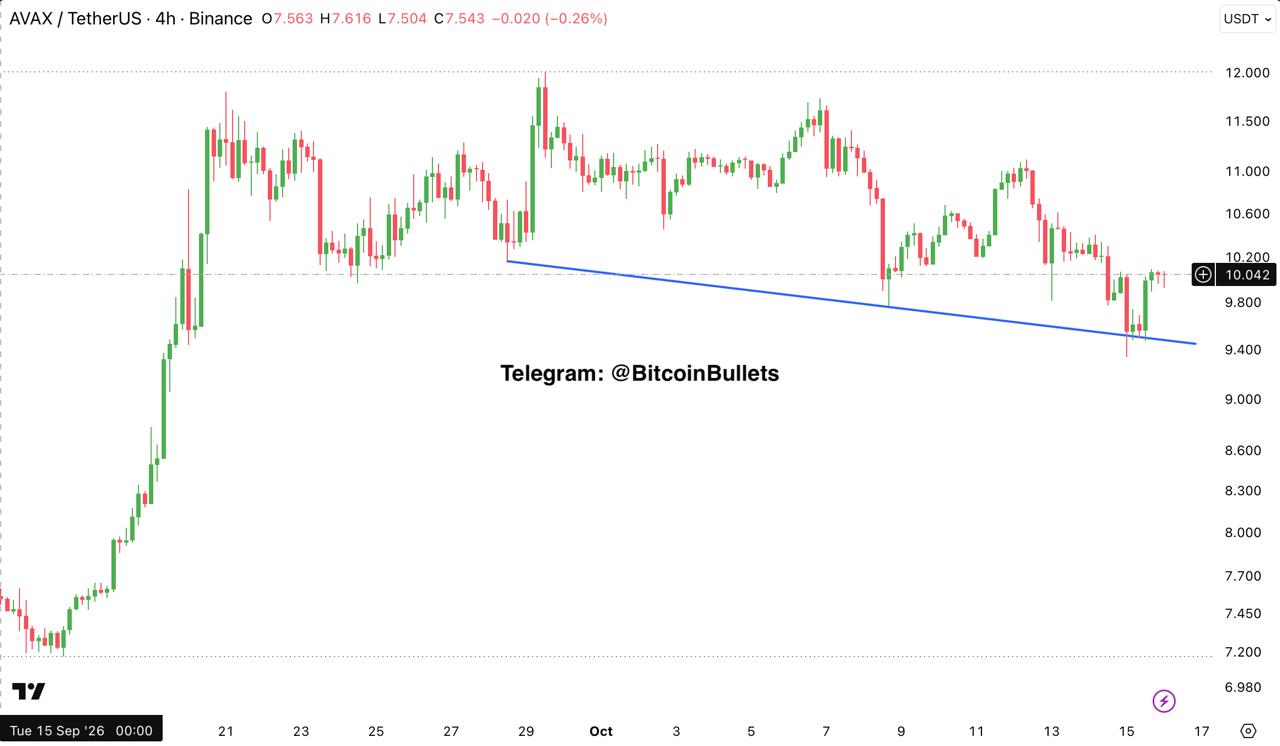
After a dip to about 9.35 where buyers immediately stepped in, AVAX has recovered to roughly 10.04 and is now once again testing the 10.20 mark, the level that stopped its previous rise; it is unclear yet whether it can get past it or rolls over again.
If price moves up: if price climbs back above 10.20 → possible move toward 10.60 and then the 11.00 area
If price moves down: if price is turned back here and slips below 9.50 → likely decline toward 9.00 and then 8.60, the area it shot up from in September
Published •